Our Motivation
Groundwater depletion threatens water sources of the American food system, and the Central Valley (CV) is one of the most productive agricultural regions in the world and a keystone in the American food system producing 40% of U.S. fruits, nuts, and vegetables. Because of this, the Central Valley aquifer is the second-most-pumped in the U.S.. Groundwater depletion occurs when the extraction rate is higher than the recharge rate and negative consequences of over-depleting groundwater sources include groundwater level declines, groundwater storage reduction, water quality degradation, land subsidence, saltwater intrusion, and negative impacts on interconnected surface waters. Significant declines during drought periods, combined with groundwater over-drafting, result in net groundwater depletion (Liu et al., 2022), and due to existing socioeconomic challenges and water contamination in the region, management of this land is crucial to best support valley farmers and residents.
The two main groups most affected by groundwater depletion are disadvantaged communities and farmers. Disadvantaged communities, especially, have been widely affected by groundwater depletion and contamination in the Central Valley as their domestic right to water is directly influenced by the high agricultural water demands of the region. Farmers face the challenging decision to avoid certain crops to decrease overall water usage. Solutions include dam construction and maintenance and groundwater allocation, but the most effective path is groundwater banking which can be used in years with high rainfall. Groundwater banking diverts flood and other surface waters into aquifers for storage and stabilizes the water supply in a cost-efficient and ecologically sustainable manner. Especially during years of abundant water, groundwater banking ensures these aquifers serve as natural groundwater reservoirs when times of drought rise. Agricultural lands are prime locations for groundwater banking as a high volume of recharge can occur in short amounts of time. To better support the livelihood of both farmers and disadvantaged communities, groundwater banking will allow both sides to not face the difficult challenges of a limited groundwater supply. There are some downsides to groundwater banking as well: One needs the capacity to channel large volumes of water to places where they can infiltrate, and water needs to stand on the ground for a while which can be damaging to soils and crops and also aid in the evaporation of water. This study resource focuses on prime locations within the Central Valley to implement groundwater banking and lessen the burden among those affected.
Our Approach
A GIS-based suitability analysis was used to identify ideal recharge locations on agricultural land based on data including soil properties, land use, and hydrogeology using a self-designed ranking system. Final areas were selected based on disadvantaged communities and dry domestic wells to determine ideal spaces that prioritize alleviating groundwater stress for residents of the Central Valley facing water shortages.
- Soil Suitability: Soil percolation suitability to accommodate groundwater recharge while maintaining healthy soils, crops, and a clean groundwater supply was determined using the Soil and Groundwater Banking Index (SAGBI) developed by the Soil Resource Center at the University of California, Davis (O’Geen et al. 2015) in Figure 2. This index classified areas as Very Poor, Poor, Moderately Good, Good, and Excellent with the highest potential for recharge based on five soil suitability criteria modeled using the US Department of Agriculture Natural Resources Conservation Service digital soil survey data. Deep percolation, based on the ability of soils to readily transmit water beyond the root zone, is derived from saturated hydraulic conductivity, (Ksat) a measure of soil permeability when soil saturates the limiting layer (soil horizon with lowest Ksat) (O’Geen et al 2015). Based on this factor, cemented layers, claypans, and strongly contrasting particle size distributions limit downward percolation. Root zone residence time measures the tolerance of crops for saturation before and after bud break throughout the entire crop root zone. Level topography is ideal for MAR as it allows for more optimal infiltration across large areas. Topography was measured by five slope classes based on slope percent running from Optimal (0%-1% and 0%-3%) to Extremely Challenging (10%-30% and 15%-45%). Chemical Limitations evaluated water quality quantified using the electrical conductivity (EC) of the soil, and soil profiles with EC < 4 dS/m were considered optimal. Soil surface condition evaluated the susceptibility of soils to compaction and other decreases in surface infiltration rates after large volumes of water are applied using the soil erosion factor and sodium adsorption ratio (SAR) where Kw values <0.20 were considered ideal (O’Geen et al. 2015). The five factors were weighted based on significance to groundwater banking: deep percolation (27.5%), root zone residence time (27.5%), topographic limitations (20%), chemical limitations (20%), and surface condition (5%).
- Land Use: The California Statewide Crop mapping was downloaded from the provisional release of statewide land use data for the Water Year 2021 (DWR). DWR collected data via remote sensing imagery and field surveys to identify crop types and quantify crop acreages. Crop Types were ranked on a scale from 1 to 5 from “no tolerance” to “high tolerance” in Figure 3. The crop rating scale is based on dormancy saturation tolerance, crop tolerance for flooding, and other yield penalties associated with prolonged flooding. Field crops are ideal as they are likely left alone during the winter months; young perennial crops show a significant risk of yield loss when flooded for a long period of time (Marhawa et al. 2021). Additionally, field crops often lie idle in the winter, and crop yields are not penalized by flooding (Ganot & Dahlke, 2021). Based on these factors, ideal crops for recharge include pasture (8.6% of land parcels), grain crops (4.5% of land parcels), field crops (7.1% of land parcels), idle (8.1% of land parcels), and vineyards (8.6% of land parcels).
- Groundwater Projection: Groundwater levels, in Figure 4, were evaluated using projected groundwater level changes based on monitoring well data for the Central Valley under a ‘business as usual’ regime for 2040 based on depletion rates between 2003 and 2017 (Pauloo et al., 2019). Seasonal groundwater data from spring and fall were used to determine groundwater level changes from unconfined and semi-confined aquifers tapped by domestic wells (Pauloo et al., 2019). Log-transformed groundwater levels were used to normalize the data distribution. The groundwater level index scales groundwater level change from 1- projected groundwater increase to 5- greatest groundwater level decrease for 2040. Projected groundwater level changes were prioritized over current groundwater levels to reflect worsening groundwater conditions that landowners in the Central Valley will face before the effective implementation of GSPs will reduce depletion rates.
Our Results
Parcels ranked 4 (Good) and 5 (Excellent/Most Suitable), in Figure 5, were identified in severely disadvantaged communities and disadvantaged communities that contain dry domestic wells. 37.0% of agricultural land in the Central Valley was identified as Good or Excellent for groundwater banking suitability and located within a DAC. 4268.09 km2 of overall land ranked as a 4 or 5 were located within a disadvantaged community. 3013.0 km2 of land ranked as a 4 or 5 were located within a disadvantaged community that contained dry domestic wells. 1956.6 km2 of land ranked as a 4 or 5 were located within a severely disadvantaged community. 1420.0 km2 of land ranked as a 4 or 5 were located within a severely disadvantaged community that contained dry wells. 37.0% of these land parcels within severely disadvantaged communities that contained dry wells were identified as deciduous fruits and nuts, 21.0% were identified as vineyards, and 11.2% were identified as idle.
The Southern Central Valley is more suitable for groundwater banking and groundwater recharge as shown in Figure 5. This correlates with the high groundwater declines projected for 2040. The northern portion of the Central Valley has parcels ranked as Good, indicating some potential to alleviate groundwater stress in disadvantaged communities but does not show as much potential as the southern portion of the Central Valley.
Despite the numerous online resources developed in association with SGMA, a gap remains between resources identifying land suitability to address and alleviate groundwater stress and conveying information to sustainable groundwater management. Increased resources and further site suitability analysis can be used to guide and inform decisions made by GSAs to meet SGMA guidelines. This land suitability analysis identifies that only 1.2% of agricultural land parcels are highly suitable for groundwater banking and managed aquifer recharge, underscoring the urgency for additional measures needed to reduce groundwater usage and replenish groundwater resources to prioritize and support residents in disadvantaged communities.
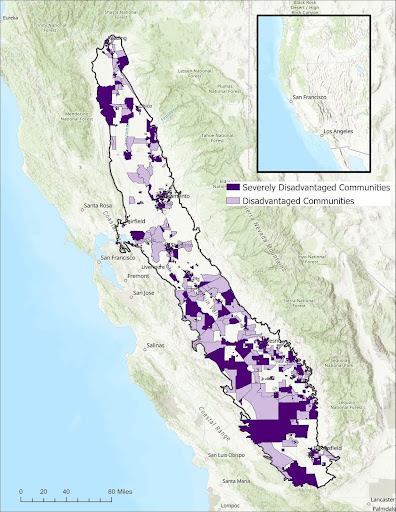
This figure breaks down areas in the Central Valley as a “Disadvantaged Community” (median household income less than 80% of the state's median household income) or “Severely Disadvantaged Community” (median household income less than 60% of the state's median household income).
Figure by Eliza Steenrod and Iris Stewart-Frey.
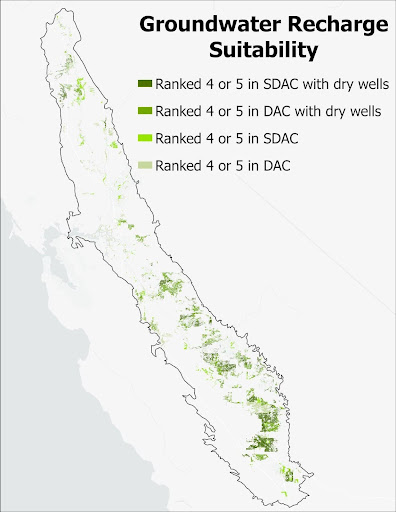
Land parcels are selected based on location within SDAC and DAC that contain dry domestic wells. Southern Central Valley is shown to have the most potential for groundwater banking and groundwater recharge.
Figure by Eliza Steenrod and Iris Stewart-Frey.
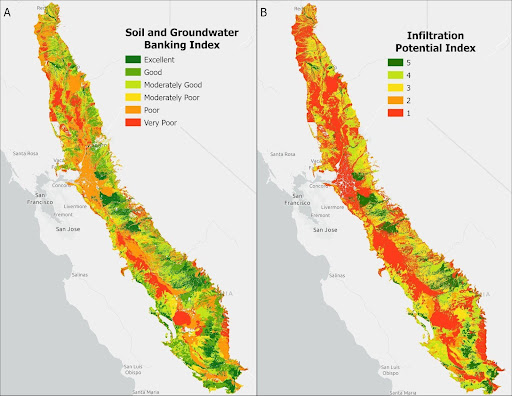
Using the Soil and Groundwater Banking Index (SAGBI) developed by the Soil Resource Center at the University of California, Davis, the five soil suitability criteria include soil percolation ability, root zone residence time, topography, chemical limitations, and soil surface condition relating to crusting, compaction, and erosion, all of which influence percolation and recharge rates. The soil was then ranked based on its potential for recharge.
Figure by Eliza Steenrod and Iris Stewart-Frey.
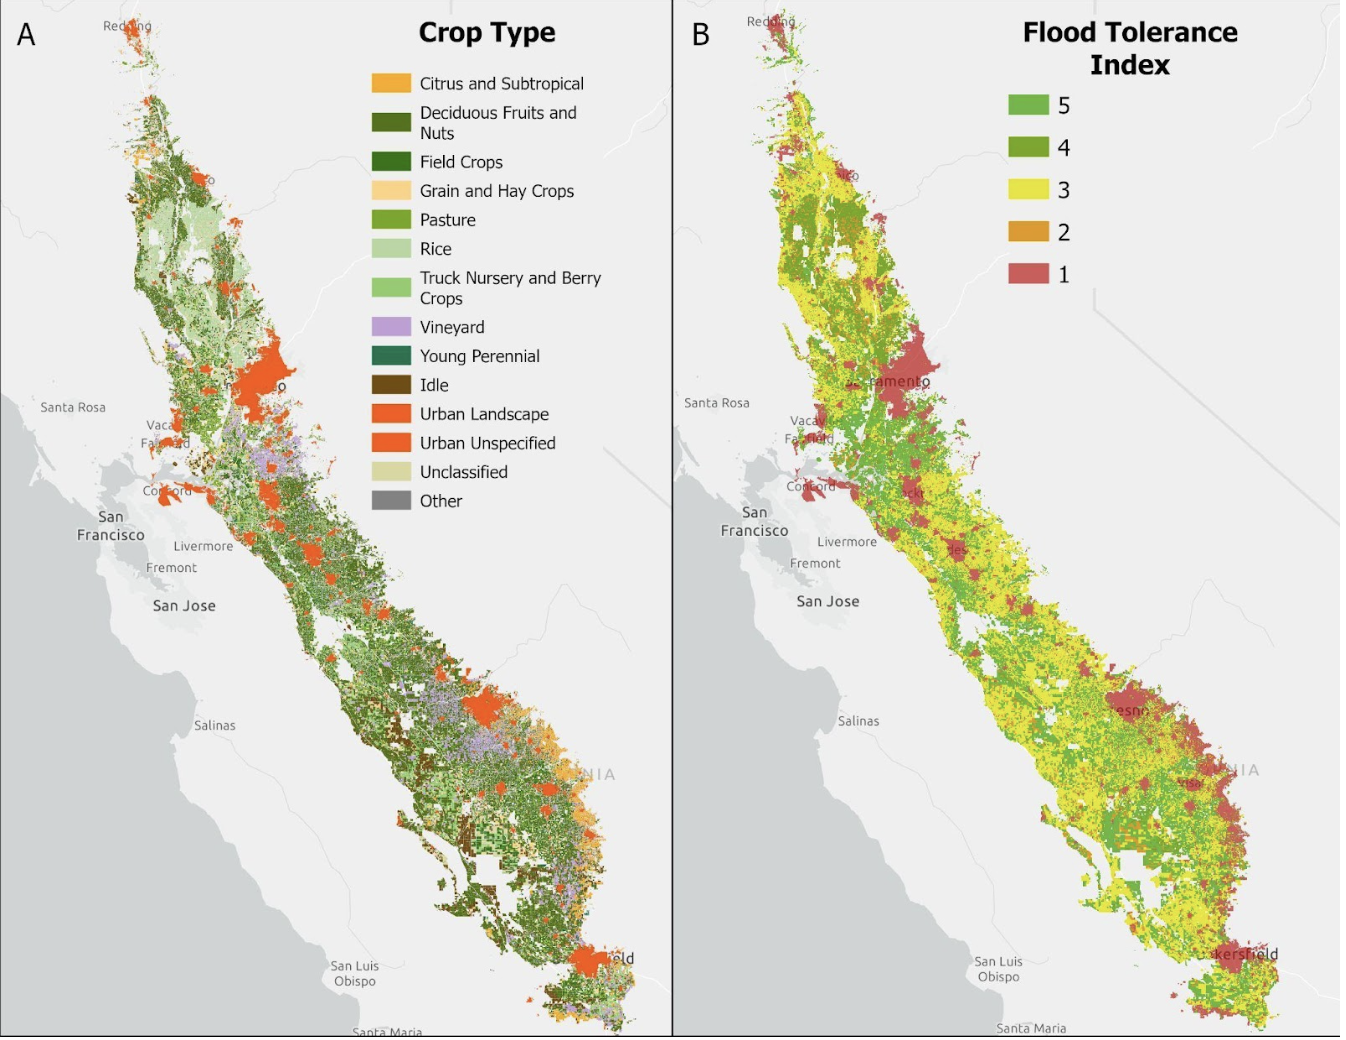
Crops were ranked based on their tolerance to prolonged flooding conditions considering factors such as dormancy saturation tolerance, crop tolerance for flooding, and other yield penalties associated with prolonged flooding
Figure by Eliza Steenrod and Iris Stewart-Frey.

(A) Central Valley projected groundwater level change for 2040 relative to data obtained between 2003 to 2017 under a business-as-usual groundwater management regime (Pauloo et al., 2019). (B) Groundwater Level Index was developed using a rating scale where 5 is most suitable for groundwater recharge due to high projected depletion.
Figure by Eliza Steenrod and Iris Stewart-Frey.
