Our Motivation
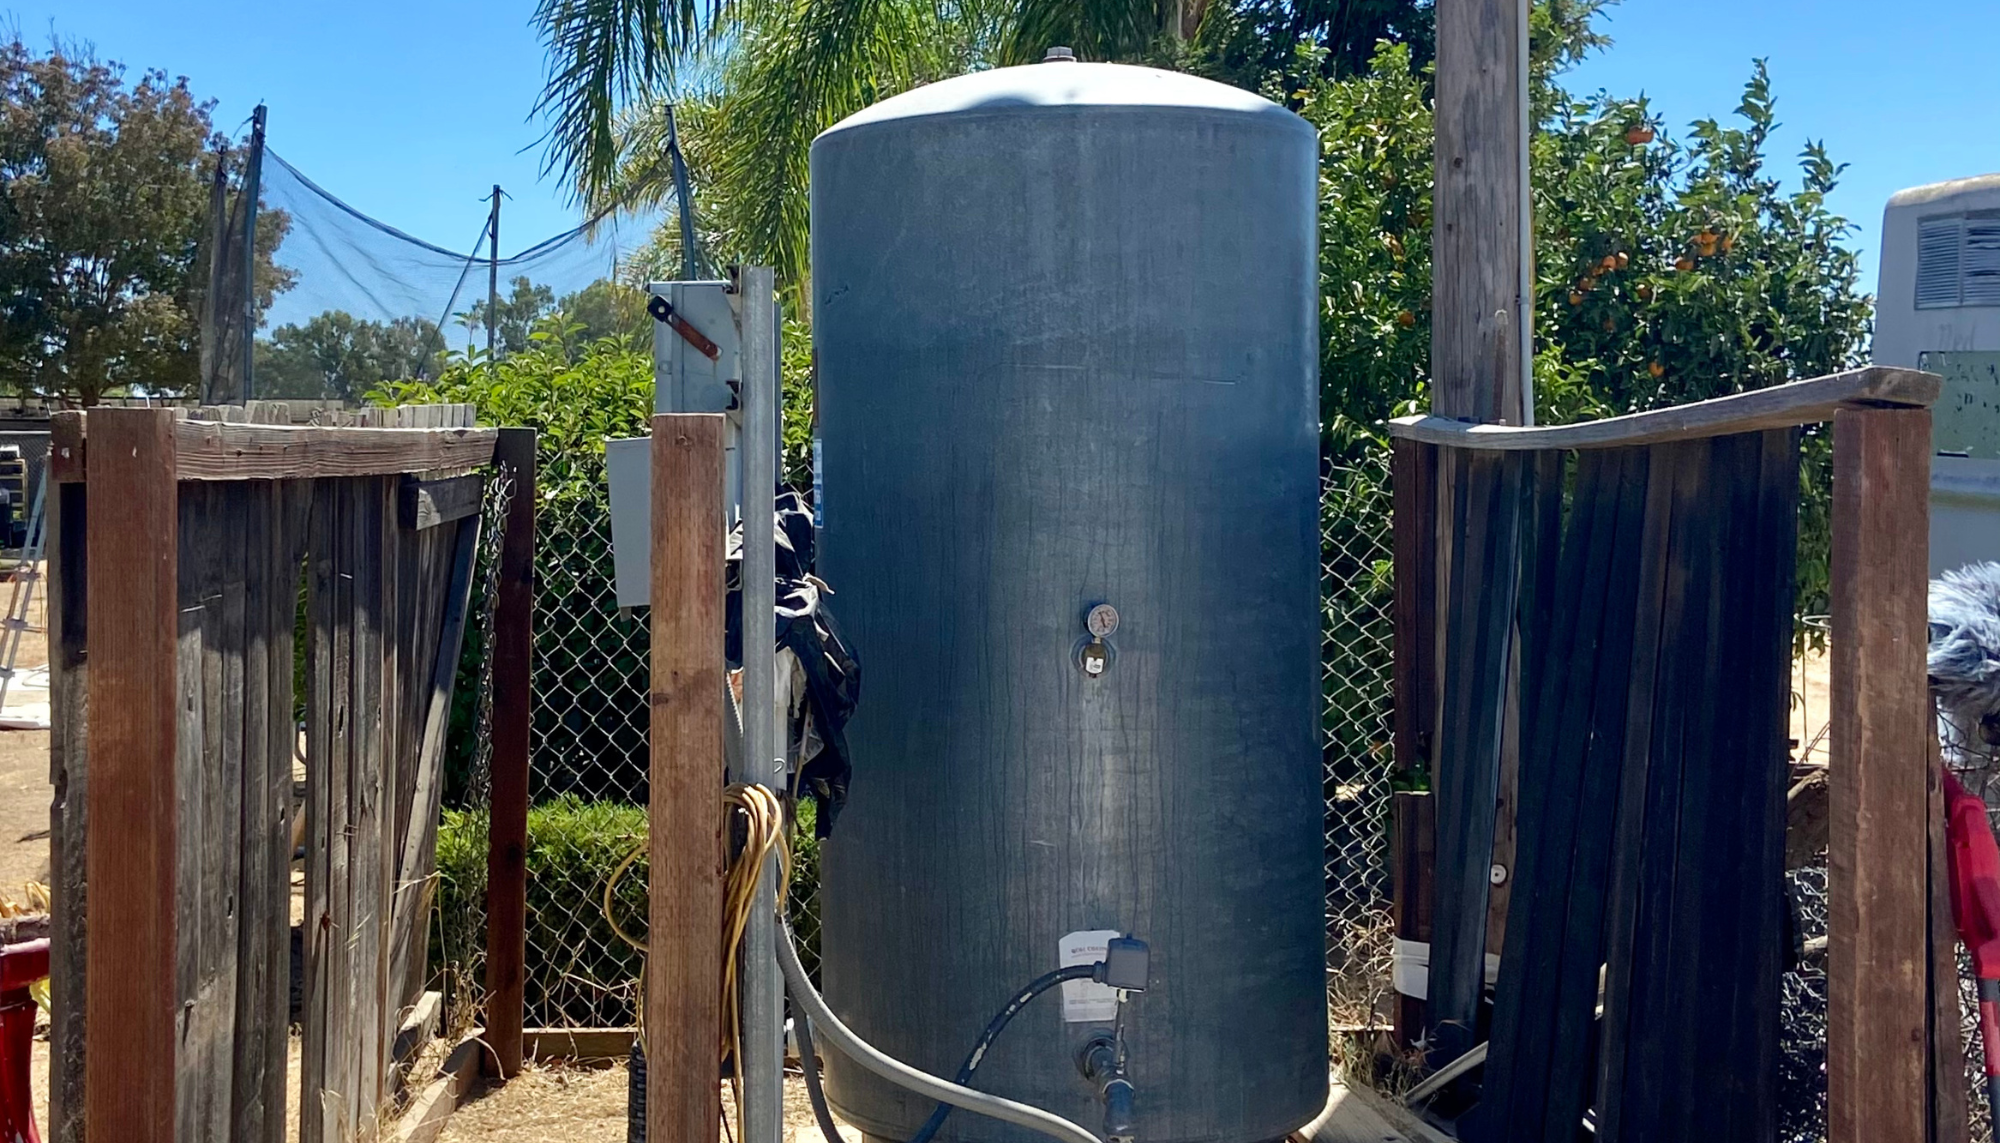
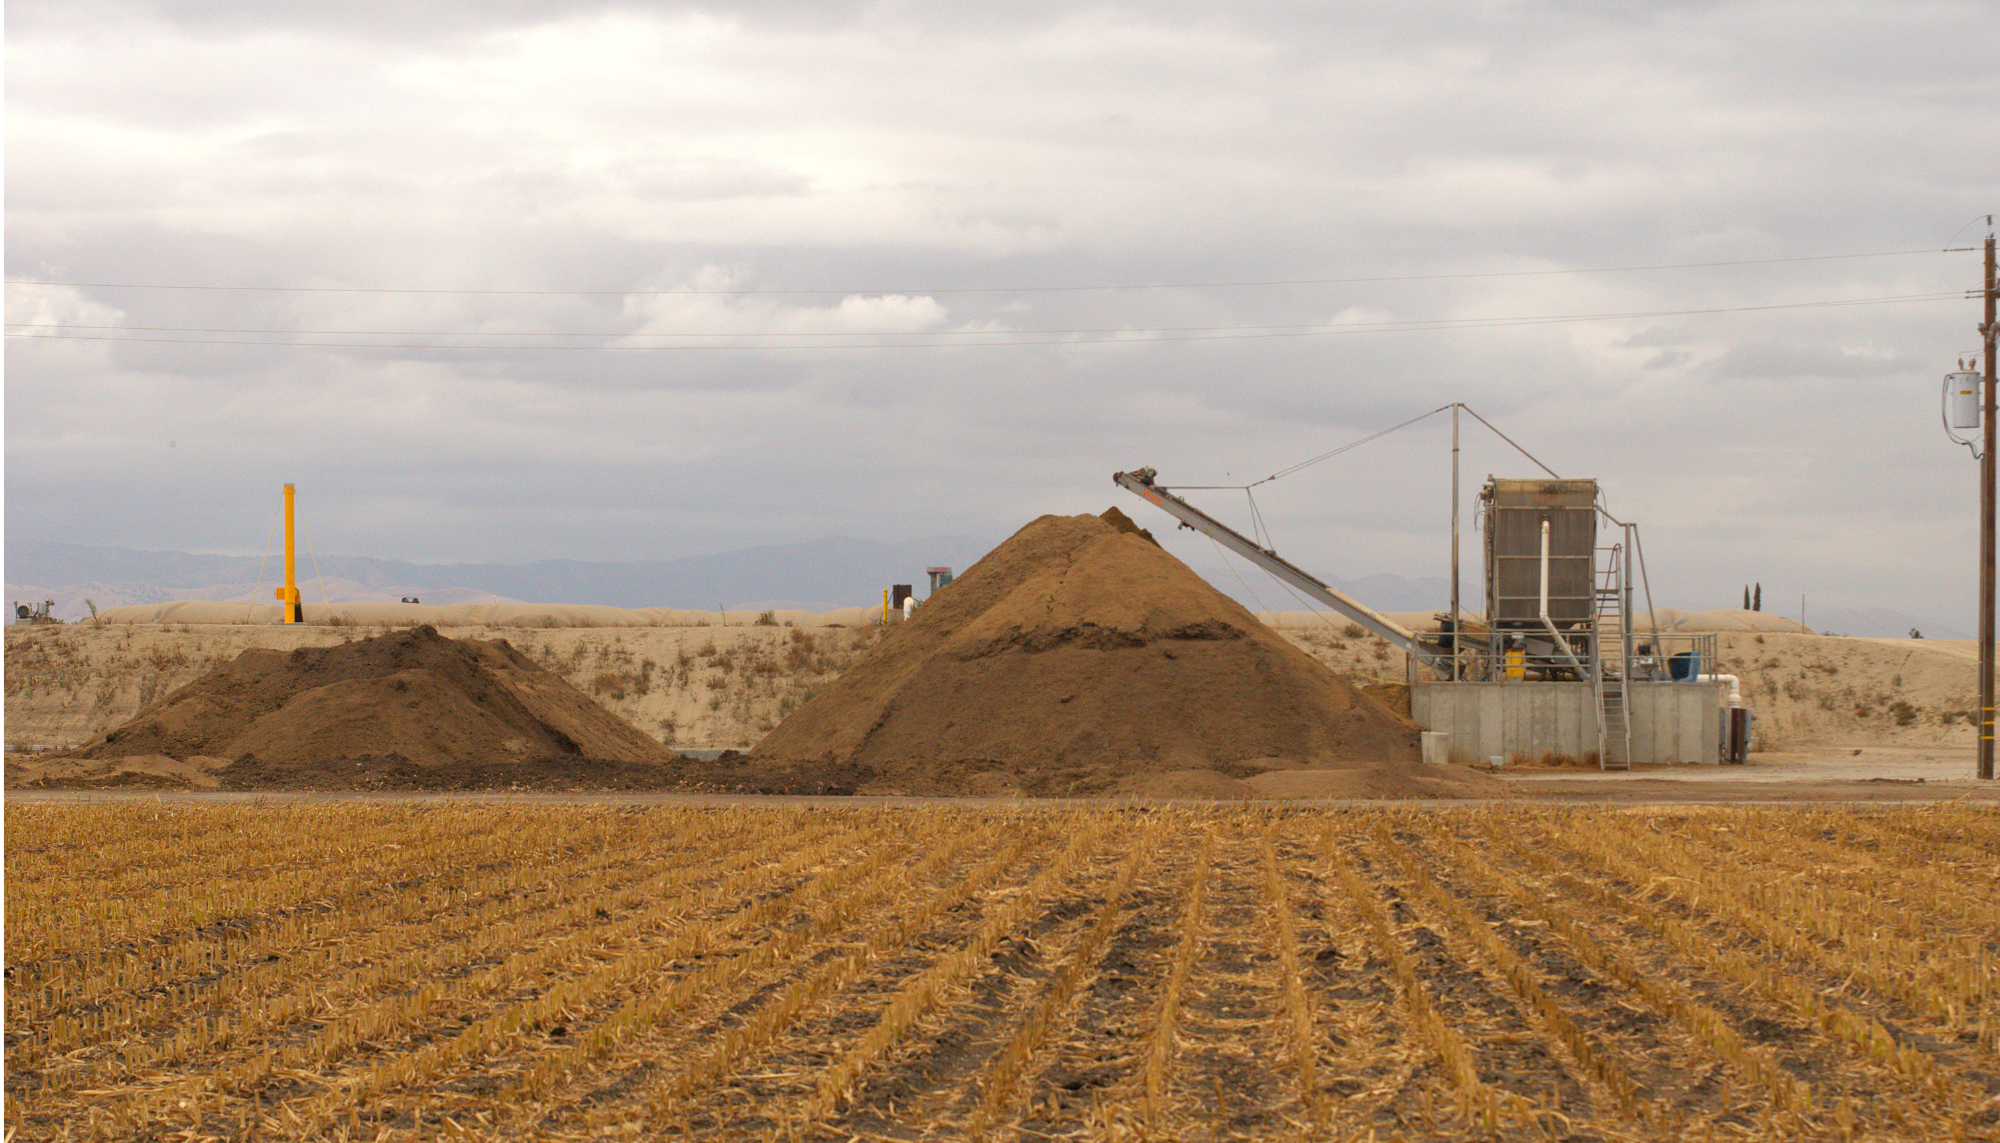
Groundwater contamination from agricultural practices and decreased water levels across the Central Valley have affected disadvantaged communities for decades, with at least 100,000 domestic well users vulnerable to nitrate levels above the maximum contaminant level (MCL) at 10 mg/L. Though sources of nitrates have been identified to agricultural fertilizers and animal waste lagoons associated with Confined Animal Feeding Operations (CAFOs), this widespread groundwater nitrate contamination continues to persist. CV-SALTS, a state-enforced program, was created in 2006 to provide free well-testing for impacted residents, but public databases (i.e. GAMA) do not contain sufficient results to determine how nitrate is varying in space and time. While some wells remain untested, others are tested at infrequent rates and inconsistent timing. Wells tested at 7.5 mg/L are expected to be retested every year in case the contamination level rises above the MCL, yet public databases often do not show this frequency. Residents who test above the MCL are eligible for free bottle water deliveries, yet their opportunity decreases if their well is not tested frequently enough to reflect their needs. The livelihood of environmental justice communities depend on these nitrate results, and therefore frequency of nitrate testing, that determine if they can continue drinking from their domestic well or require further support.
Our Approach
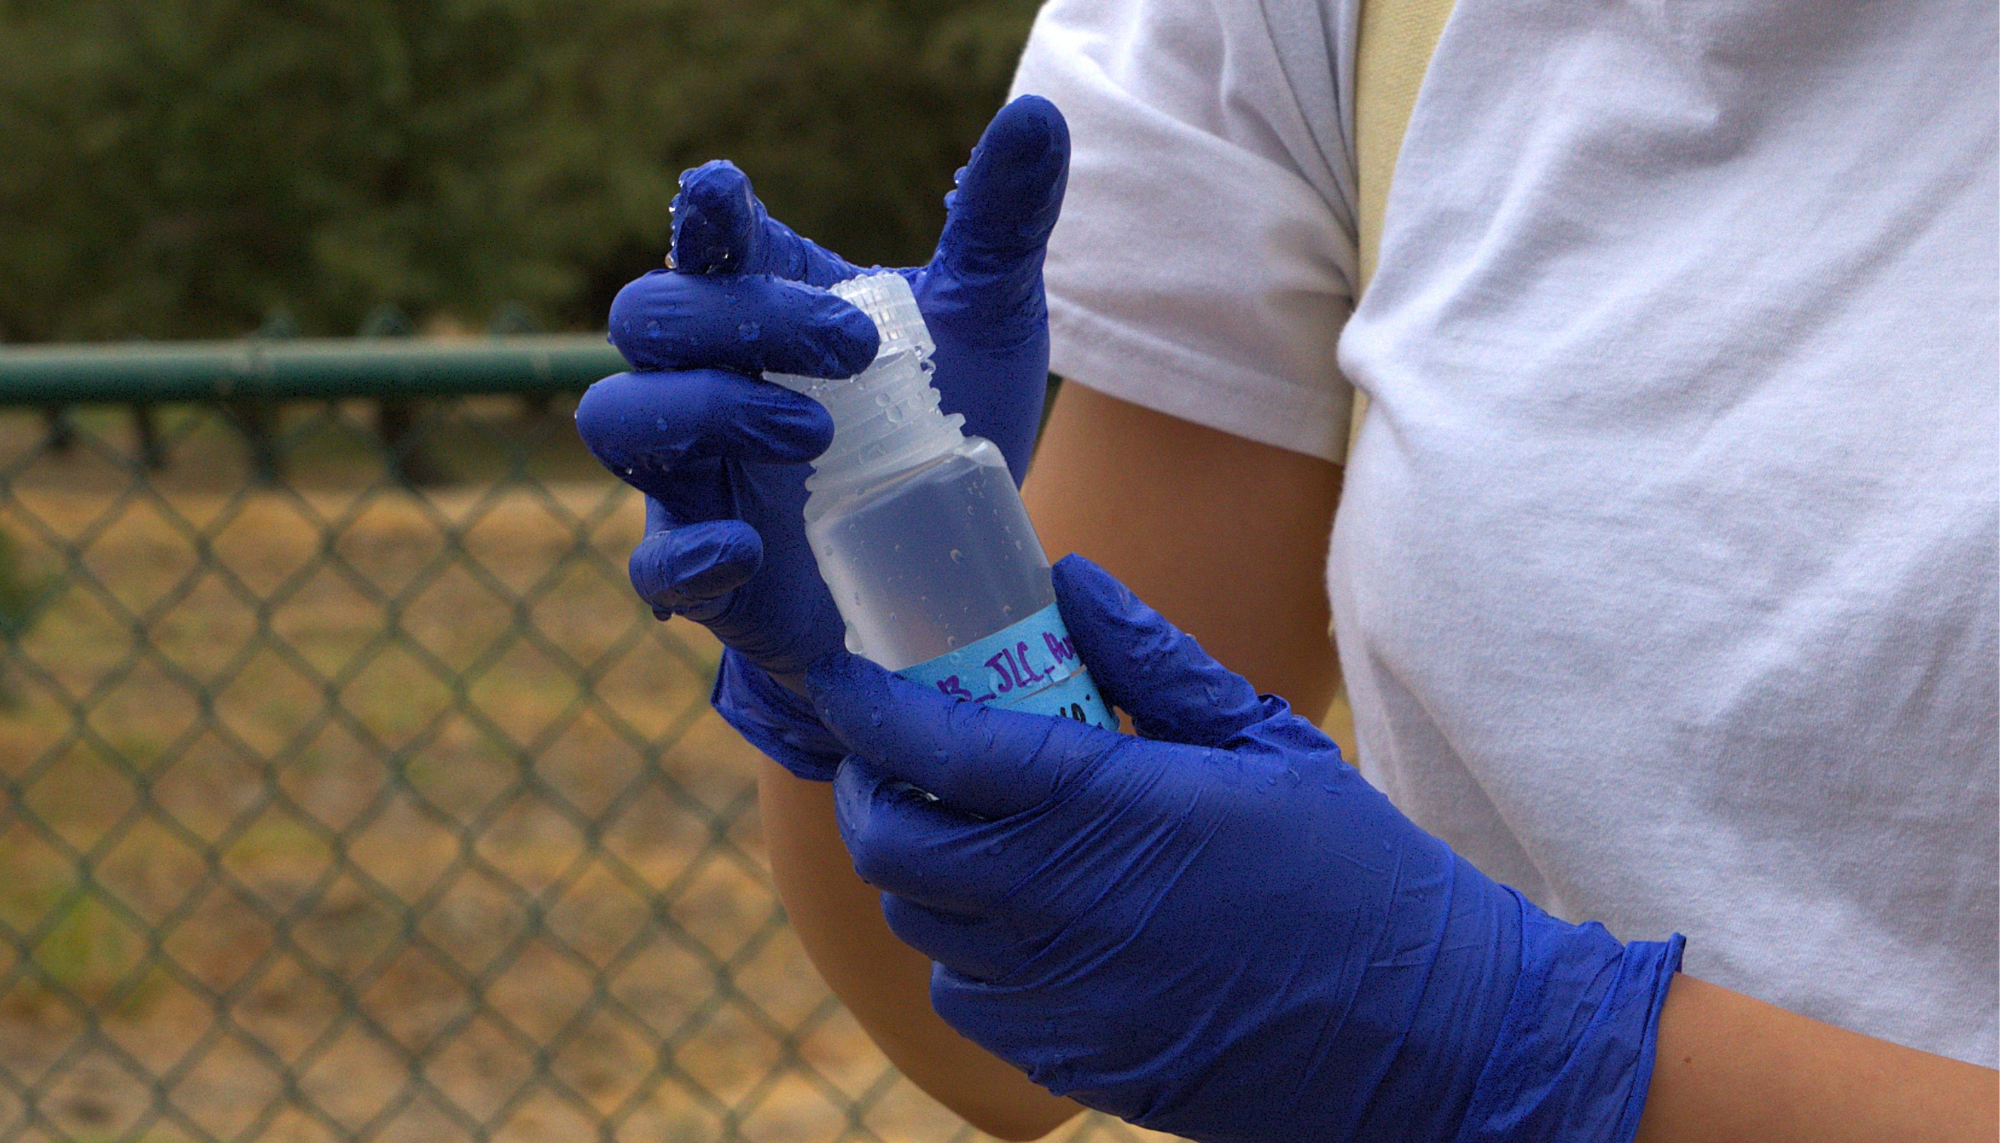
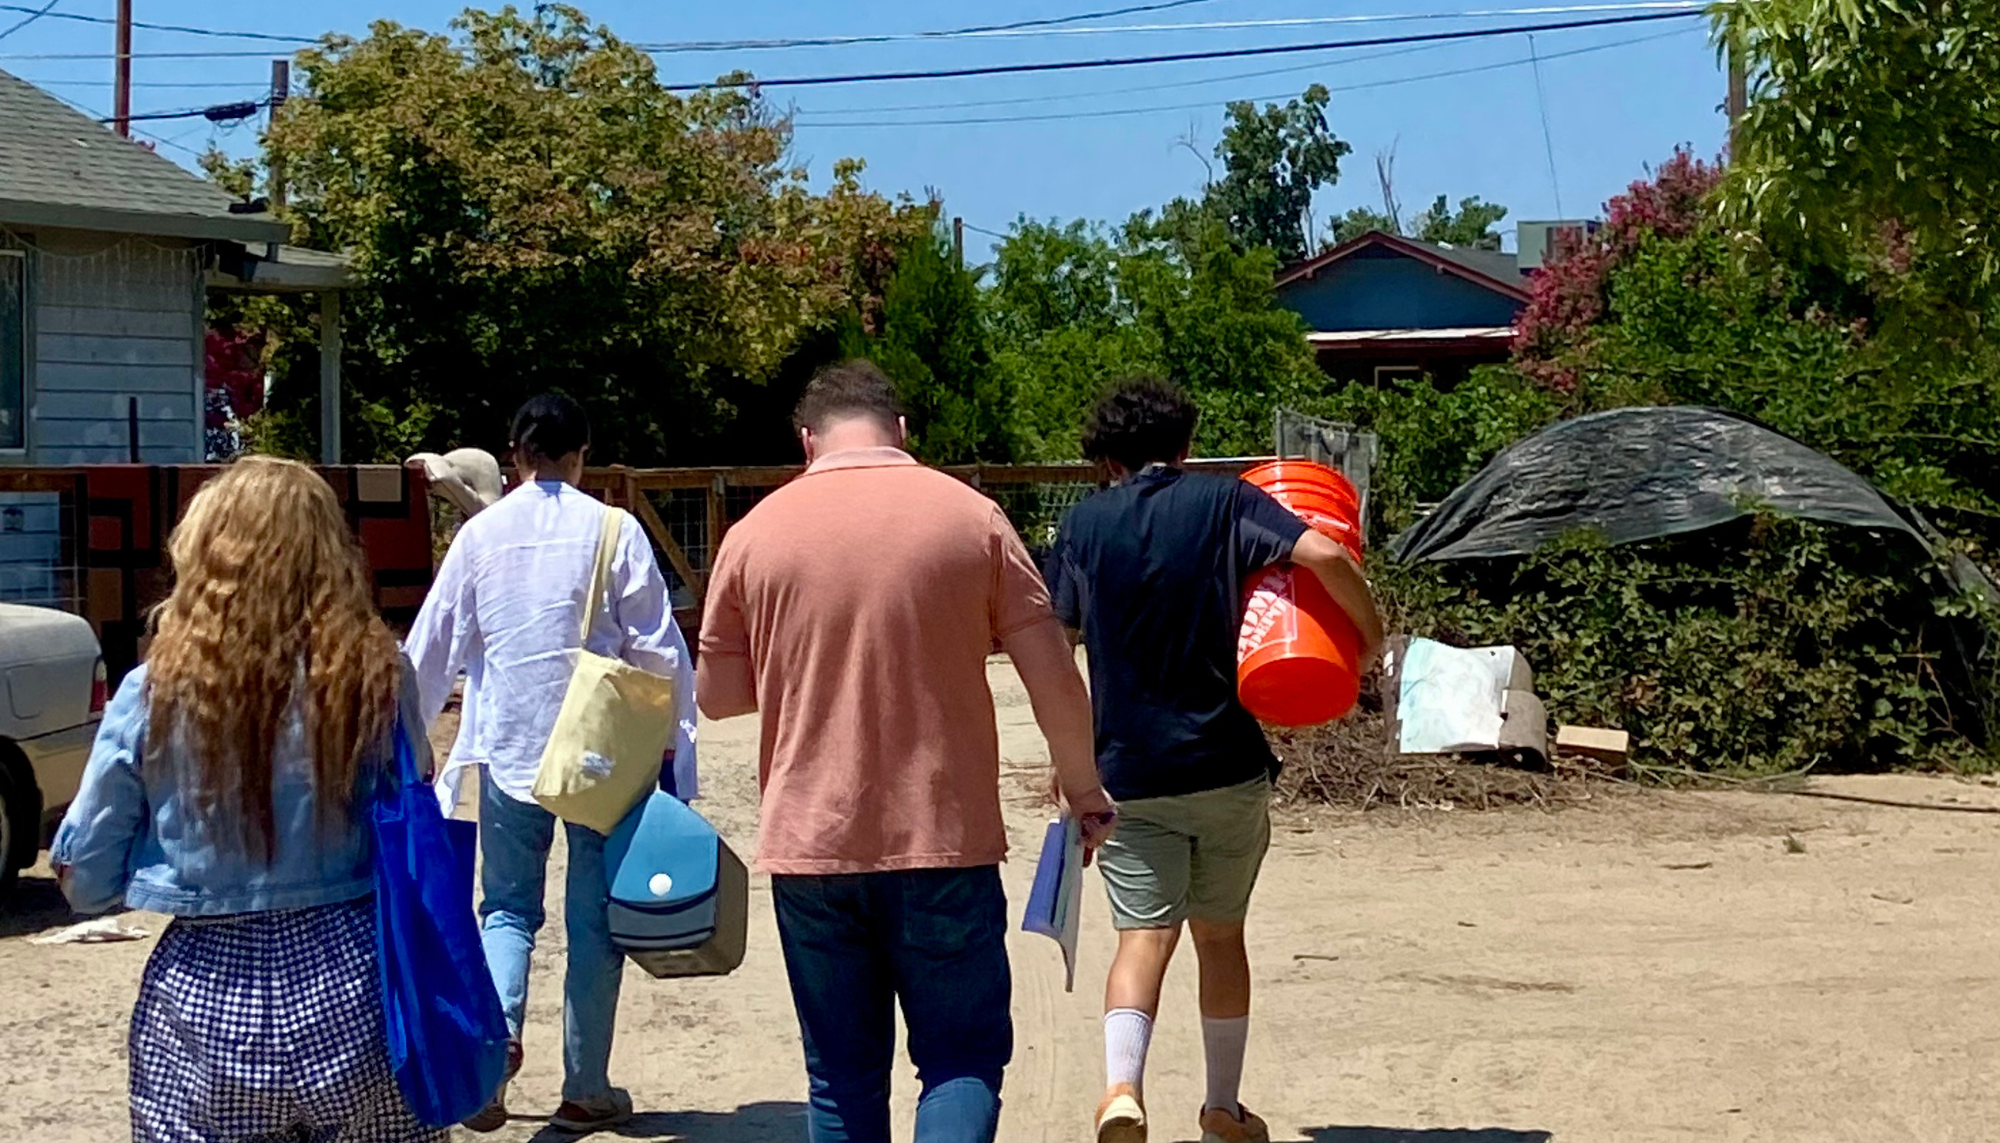
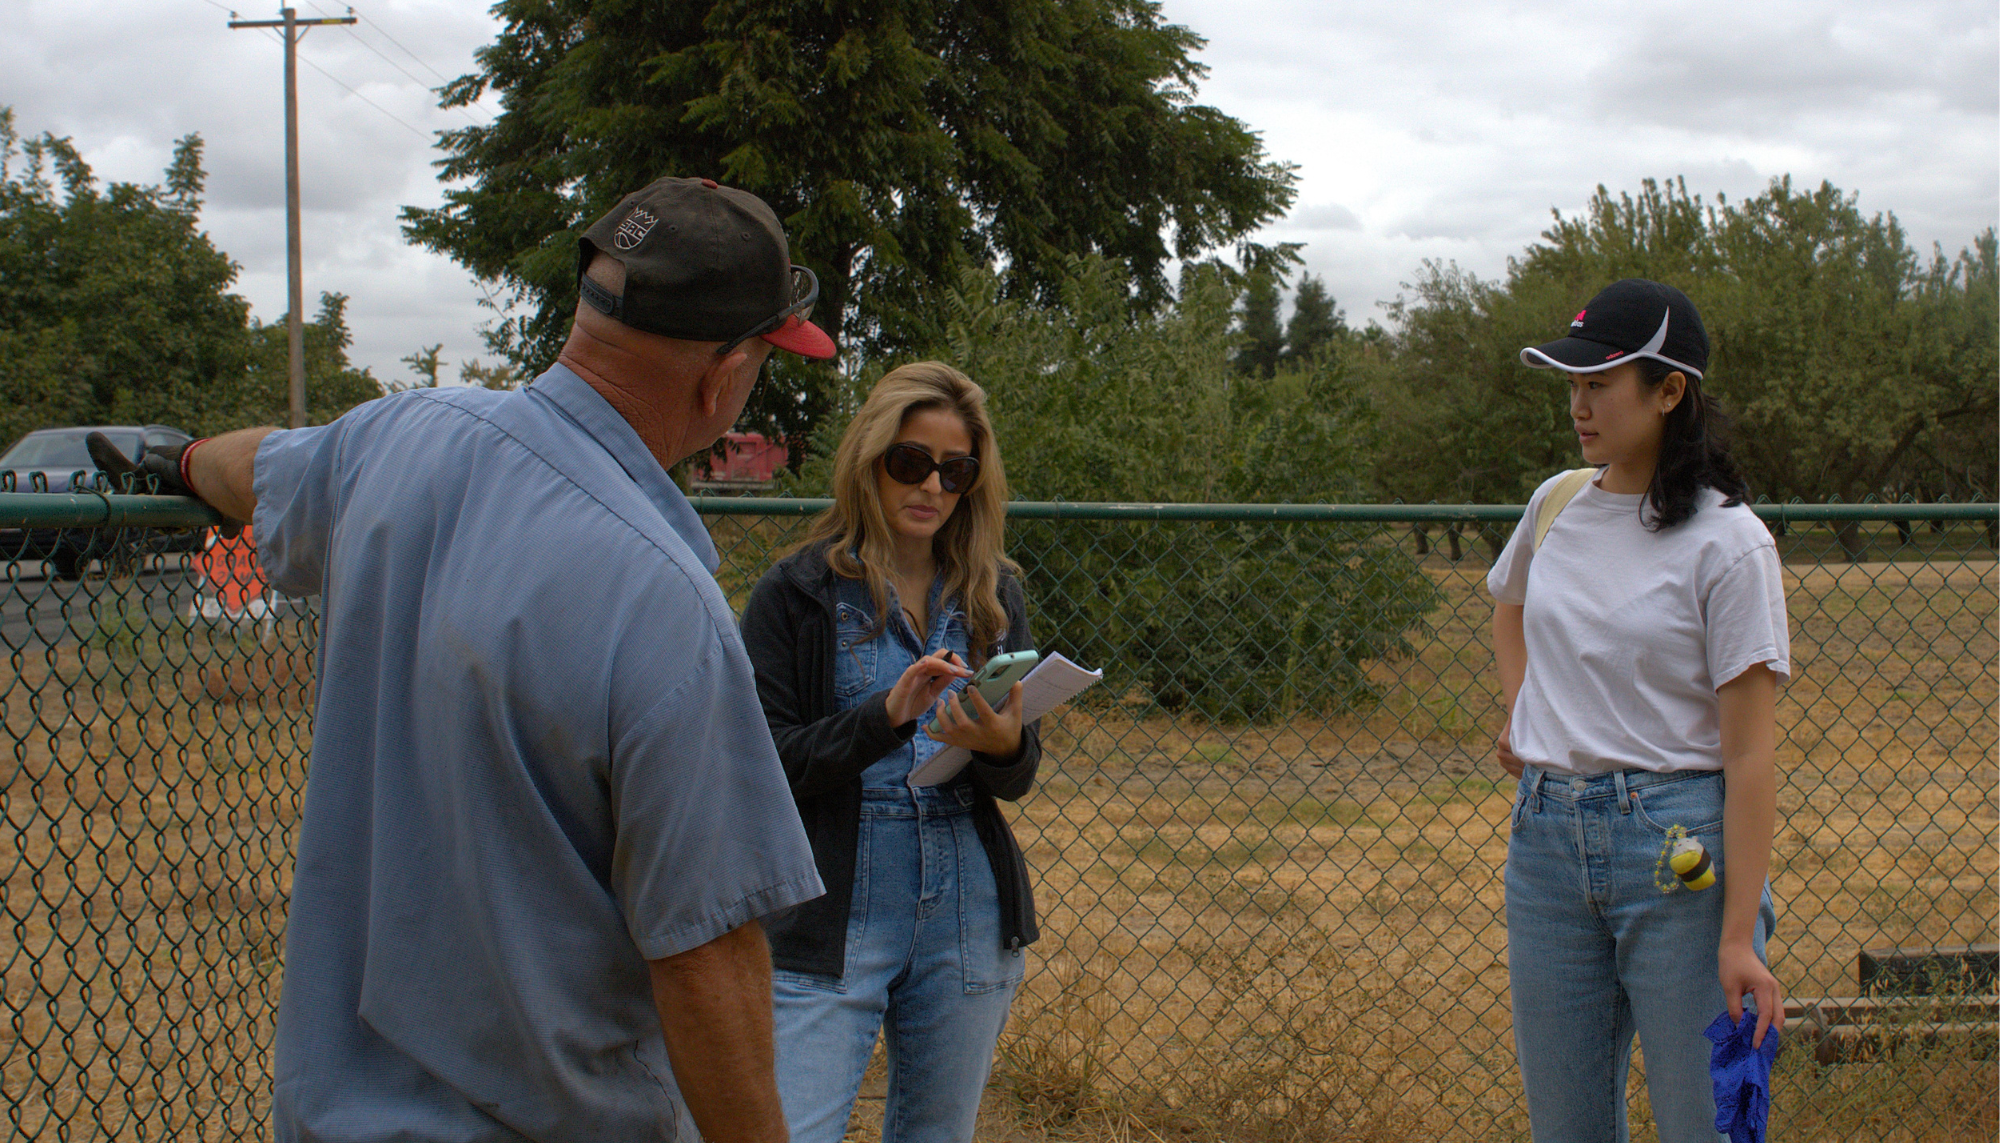
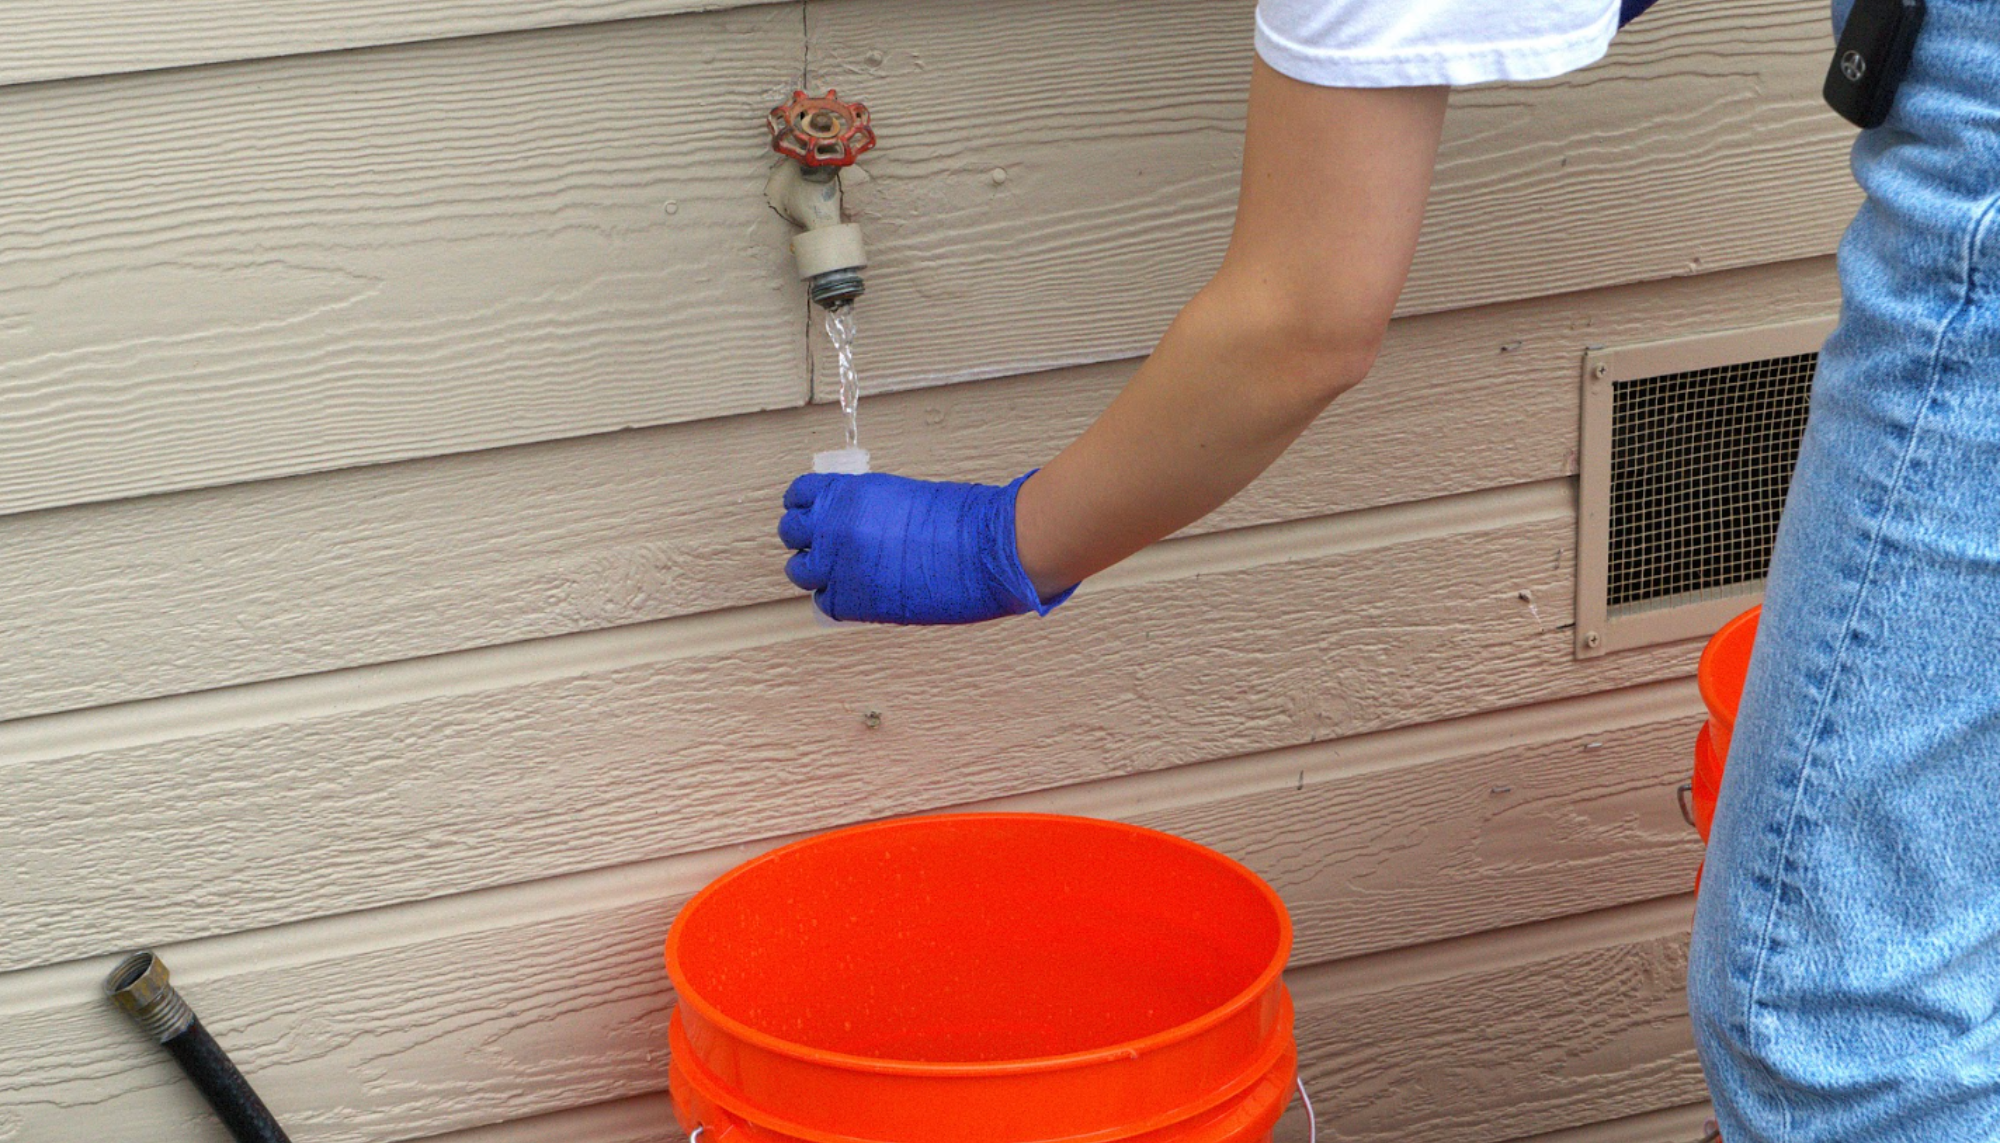
To determine whether one yearly sample provided through the CV-SALTS process is adequate and assess the seasonal variability of nitrate concentrations, we created a one-year free well testing program for nitrates from Modesto to Tulare county. A set domestic well users have been enrolled for monthly well sampling between July 2024 to June 2025 and residents are allowed to leave the program whenever they like without any repercussions. Following standard protocols, samples are collected after purging a well for 10 minutes and analyzed at Santa Clara University using the Hach Cadmium Reduction method. Triplicate samples were analyzed to provide an average and standard deviation to residents’ results. To lessen residents’ dependency on the CV-SALTS program, we will also be assessing the accuracy of affordable nitrate tests so households may feel more confident when testing their own well at their determined frequency. The results are being shared with the domestic well users in the program.
Our Results
When comparing these results to the GAMA data, 73% of well results were compared to the closest GAMA data point (ranging from 90 - 1,200m in proximity). Over 45% of the GAMA data points used for comparison did not provide the sample collection date to record how recent the well testing occurred and during which season. Among our comparison points, one well has not been tested since 2013 and the most recent well was last tested in 2022. This wide range of testing frequency limits an accurate understanding of how one resident’s nitrate contamination levels can change over time, especially wells lying on the threshold of exceeding the Maximum Contamination Level. When comparing our results from July to the GAMA data, over 45% of results were higher, 18% tested lower, and approximately 26% of results were within a close range (< 1 mg/L difference).
In 75% of cases, our collected results, in at least one of the months, are higher than the GAMA data. Domestic well sites with higher nitrate concentrations also tend to fluctuate more than sites with lower concentration levels. Residences with lower nitrate levels have had decreasing rates of nitrate concentrations from July - September.
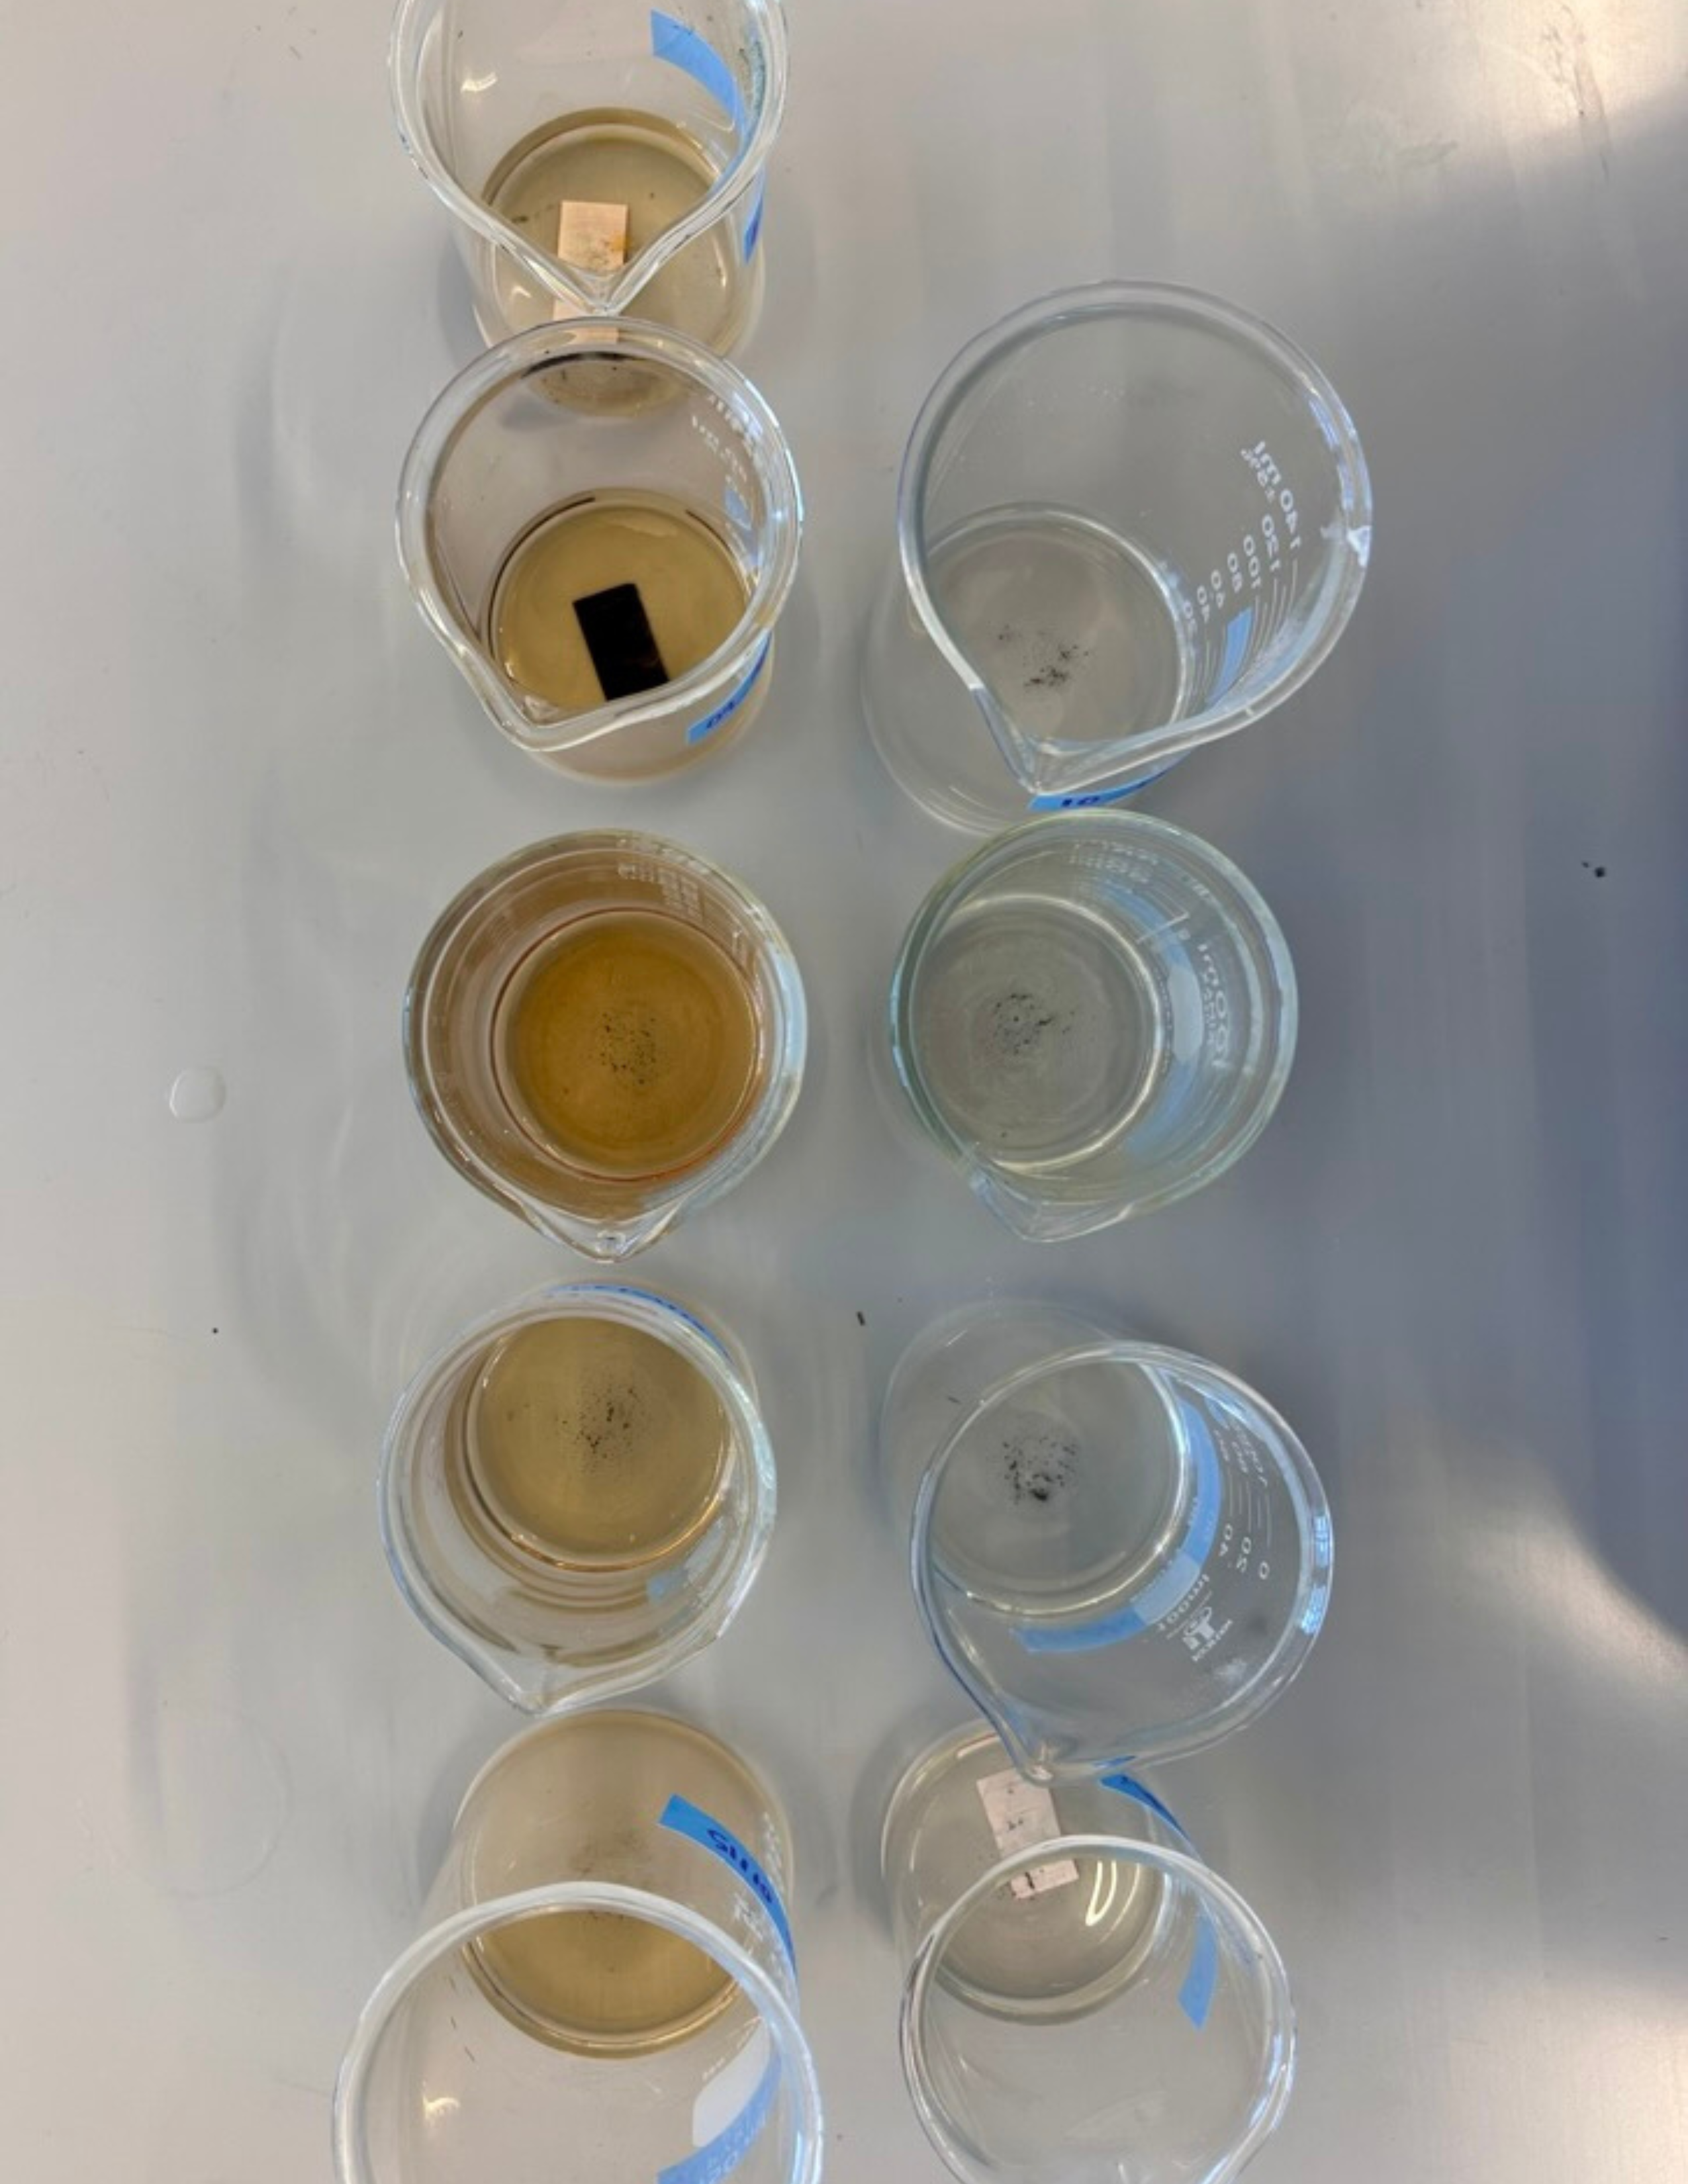
July Nitrate Samples under Hach Cadmium Reduction Process
Varying shades of amber color correlate to intensity of nitrate concentration with darker colors indicating high levels of nitrates.
Image by Samantha Lei and Aria Amirbahman.
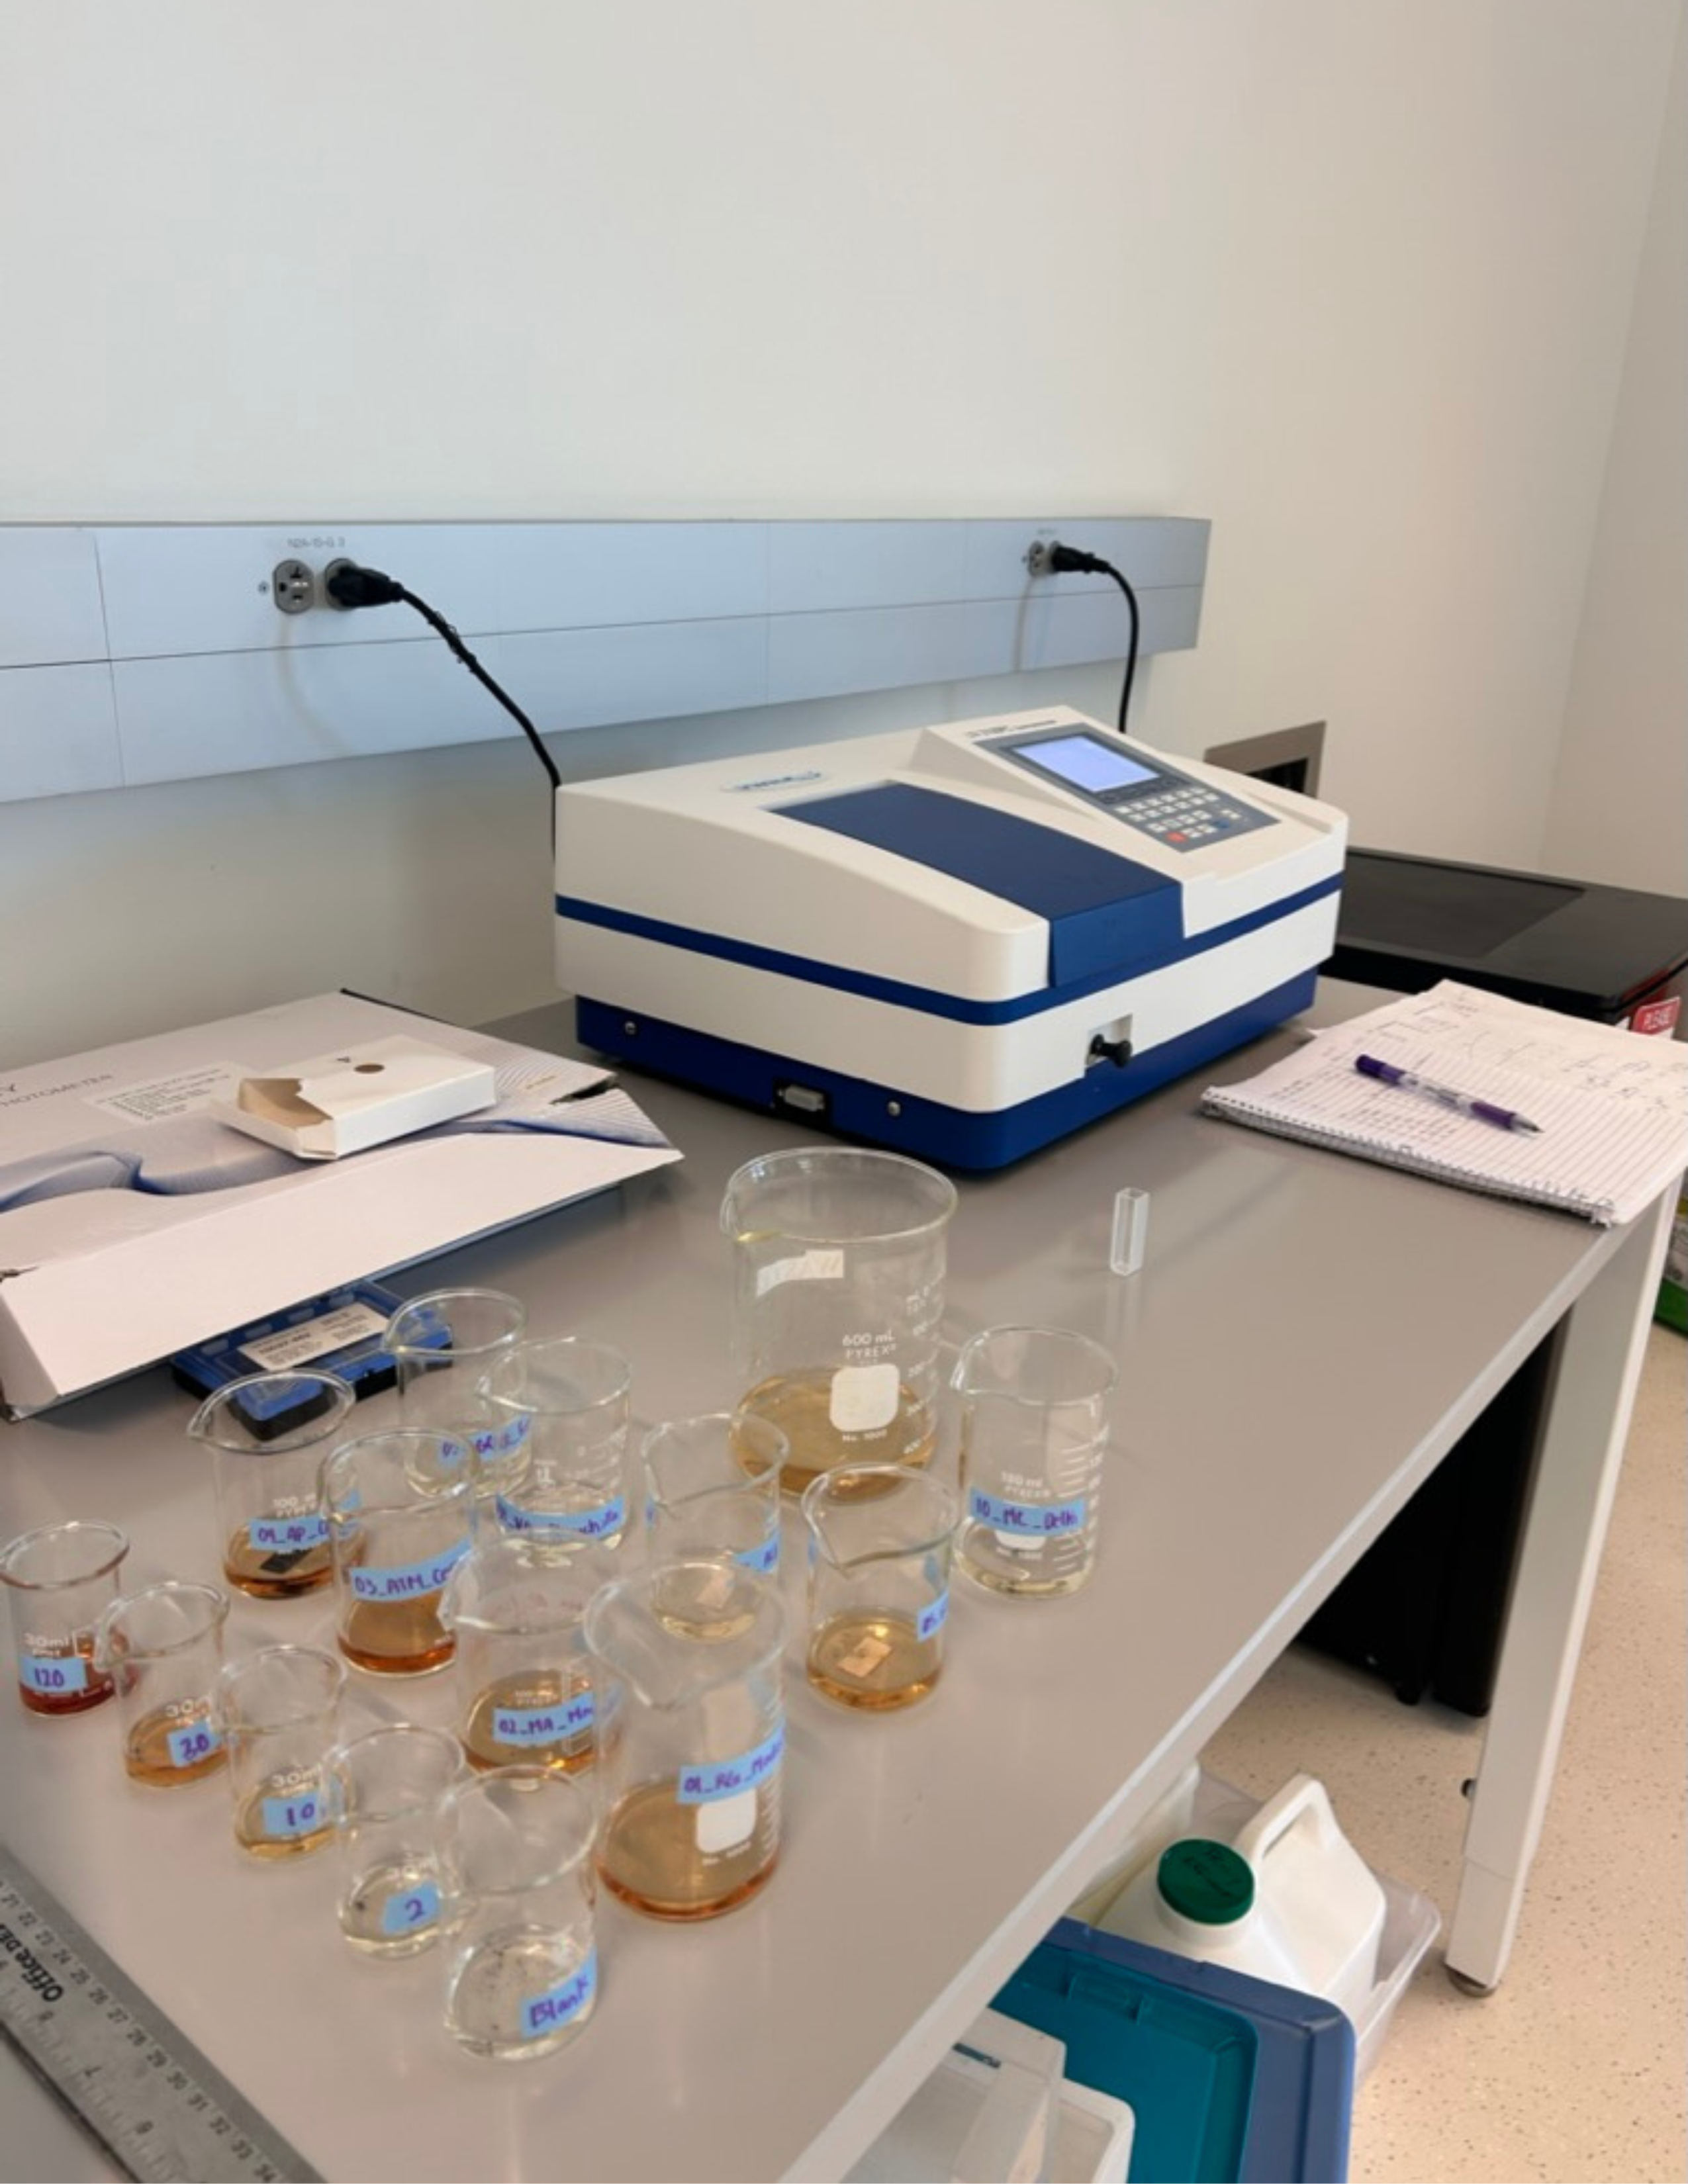
Analyzing Water Samples Using a Spectrophotometer
Spectrophotometer is used to measure absorbance values of each sample. A calibration curve was created using stock solutions to calculate nitrate concentration levels based on absorbance value.
Image by Samantha Lei and Aria Amirbahman.
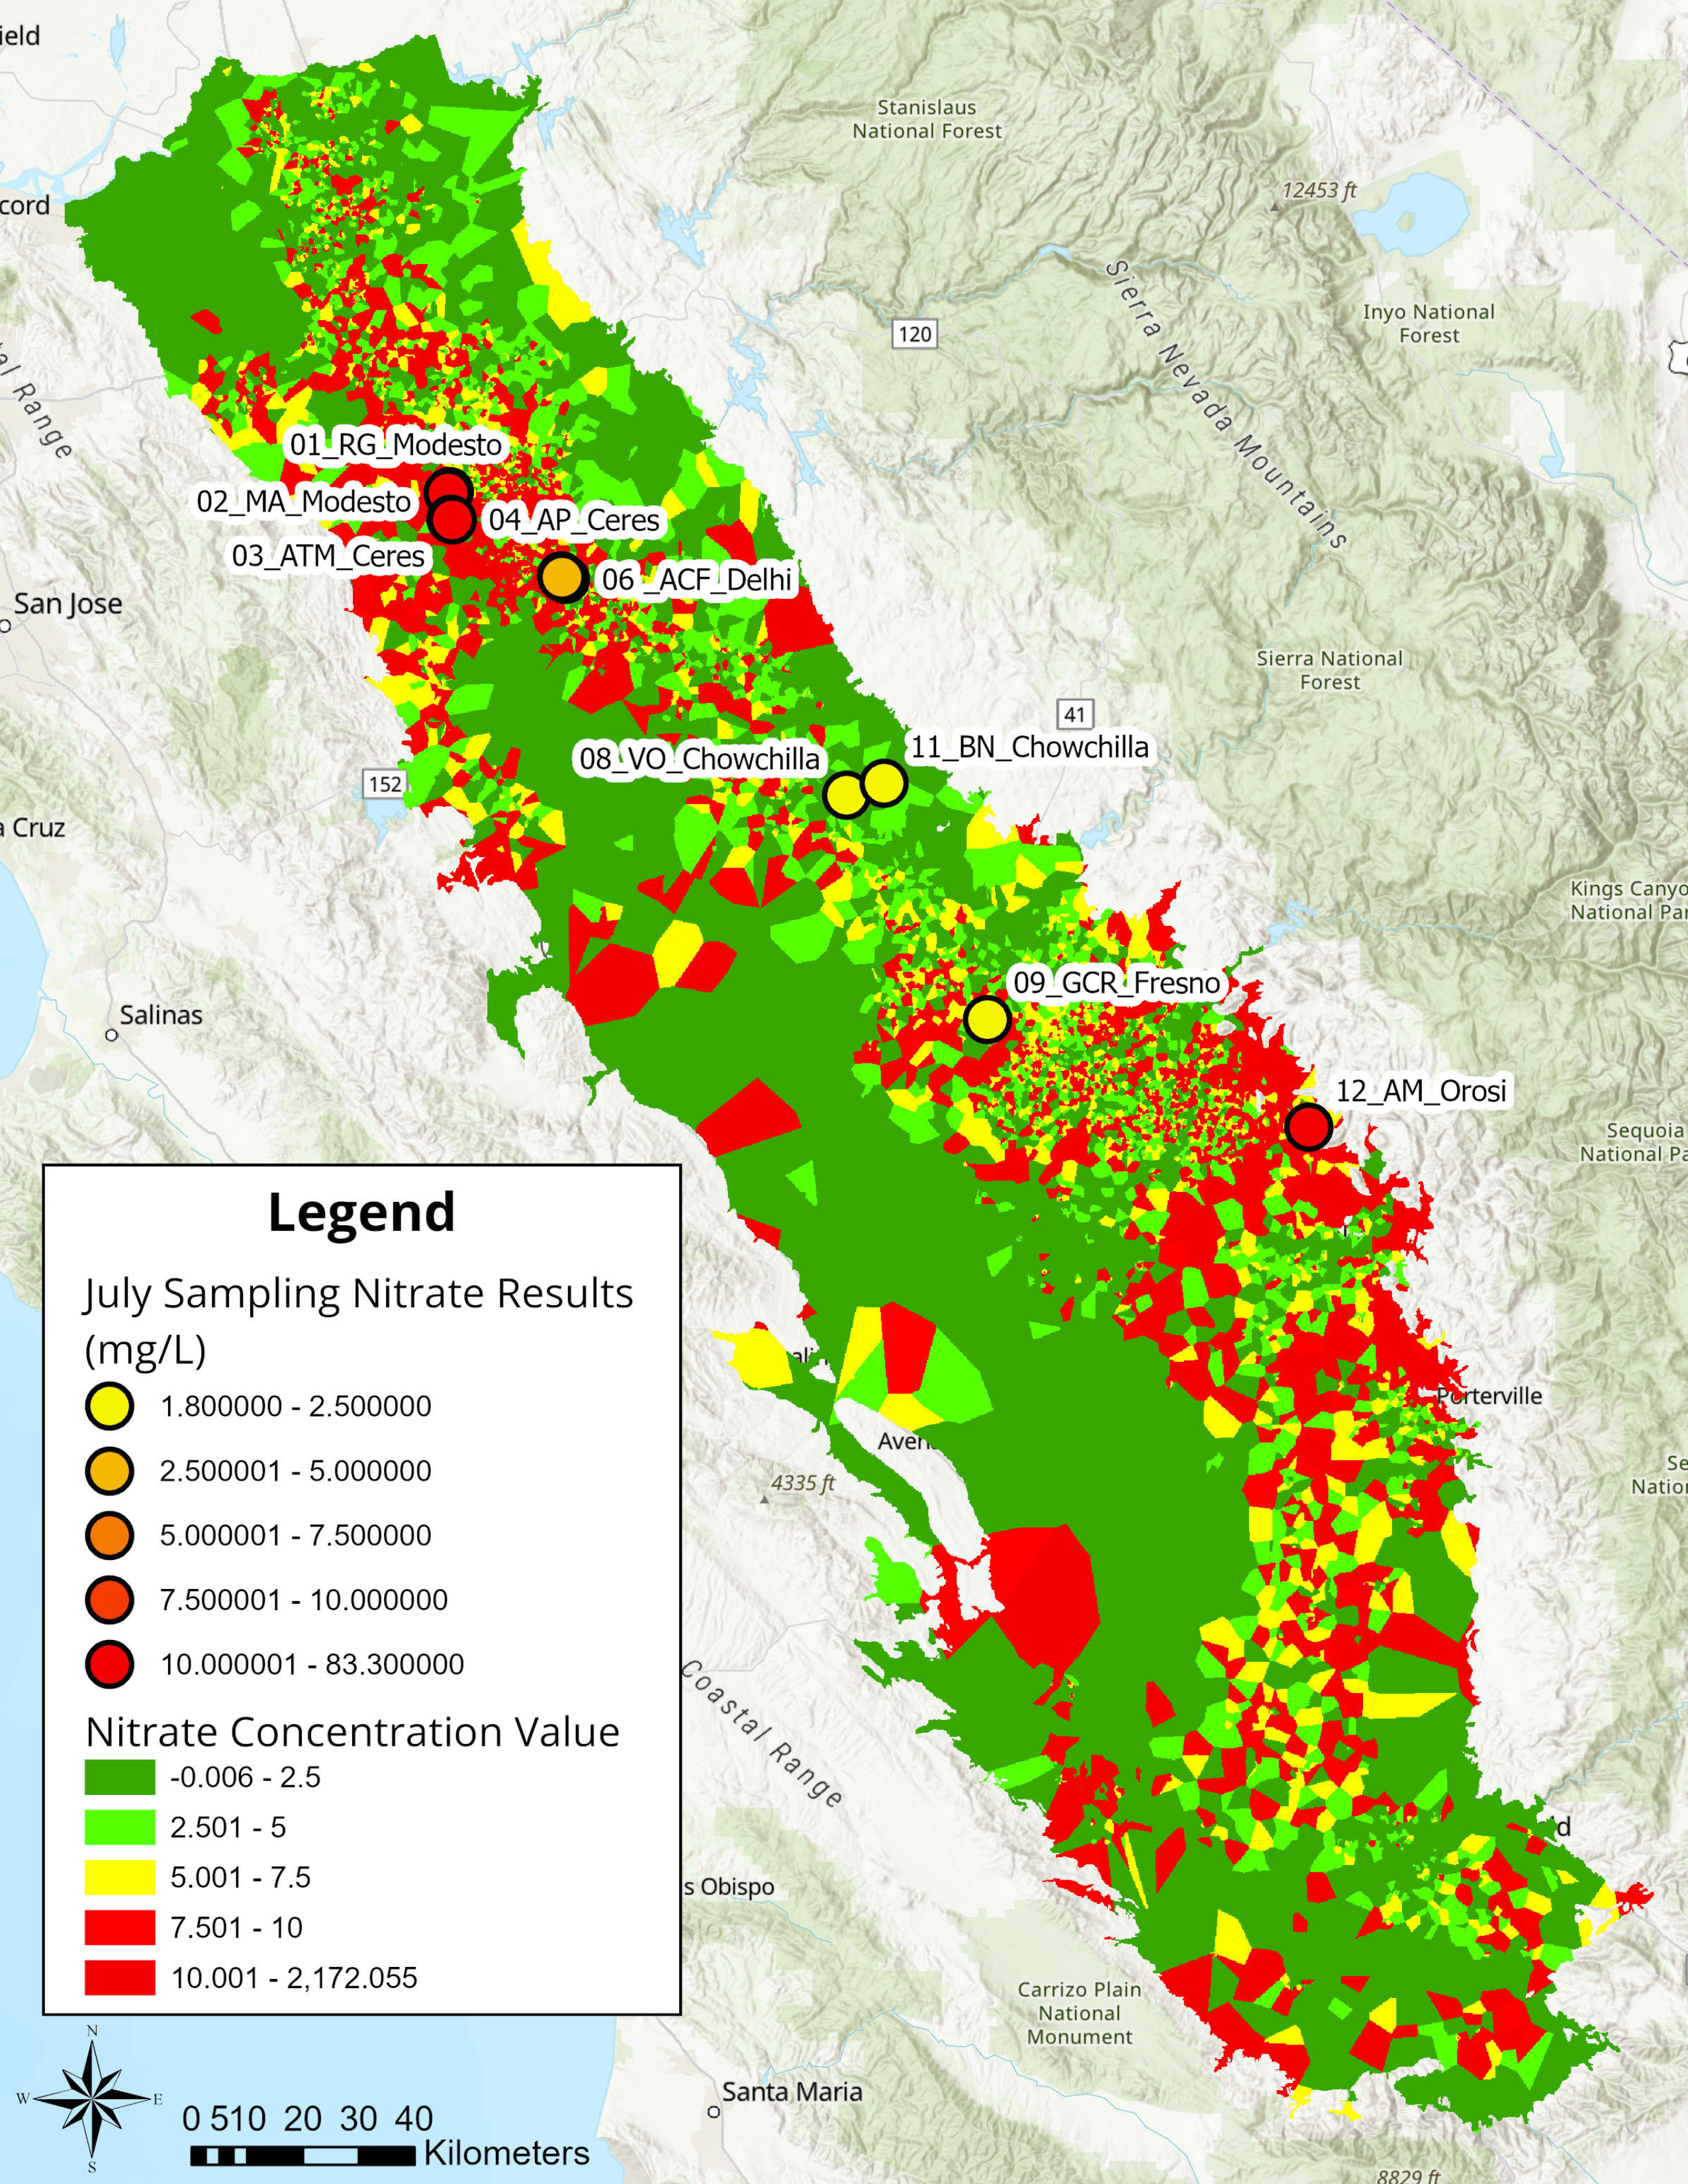
July Nitrate Results Across Nitrate Contamination Levels Throughout the Central Valley
Base layer from GAMA data was used to create the nitrate concentration variance across the Central Valley. Analyzed domestic well samples were plotted to show each any contrast between the domestic well sampled and the surrounding area.
Figure by Samantha Lei, Jake Dialesandro, Aria Amirbahman, Nick Jensen, and Rosa Torres.
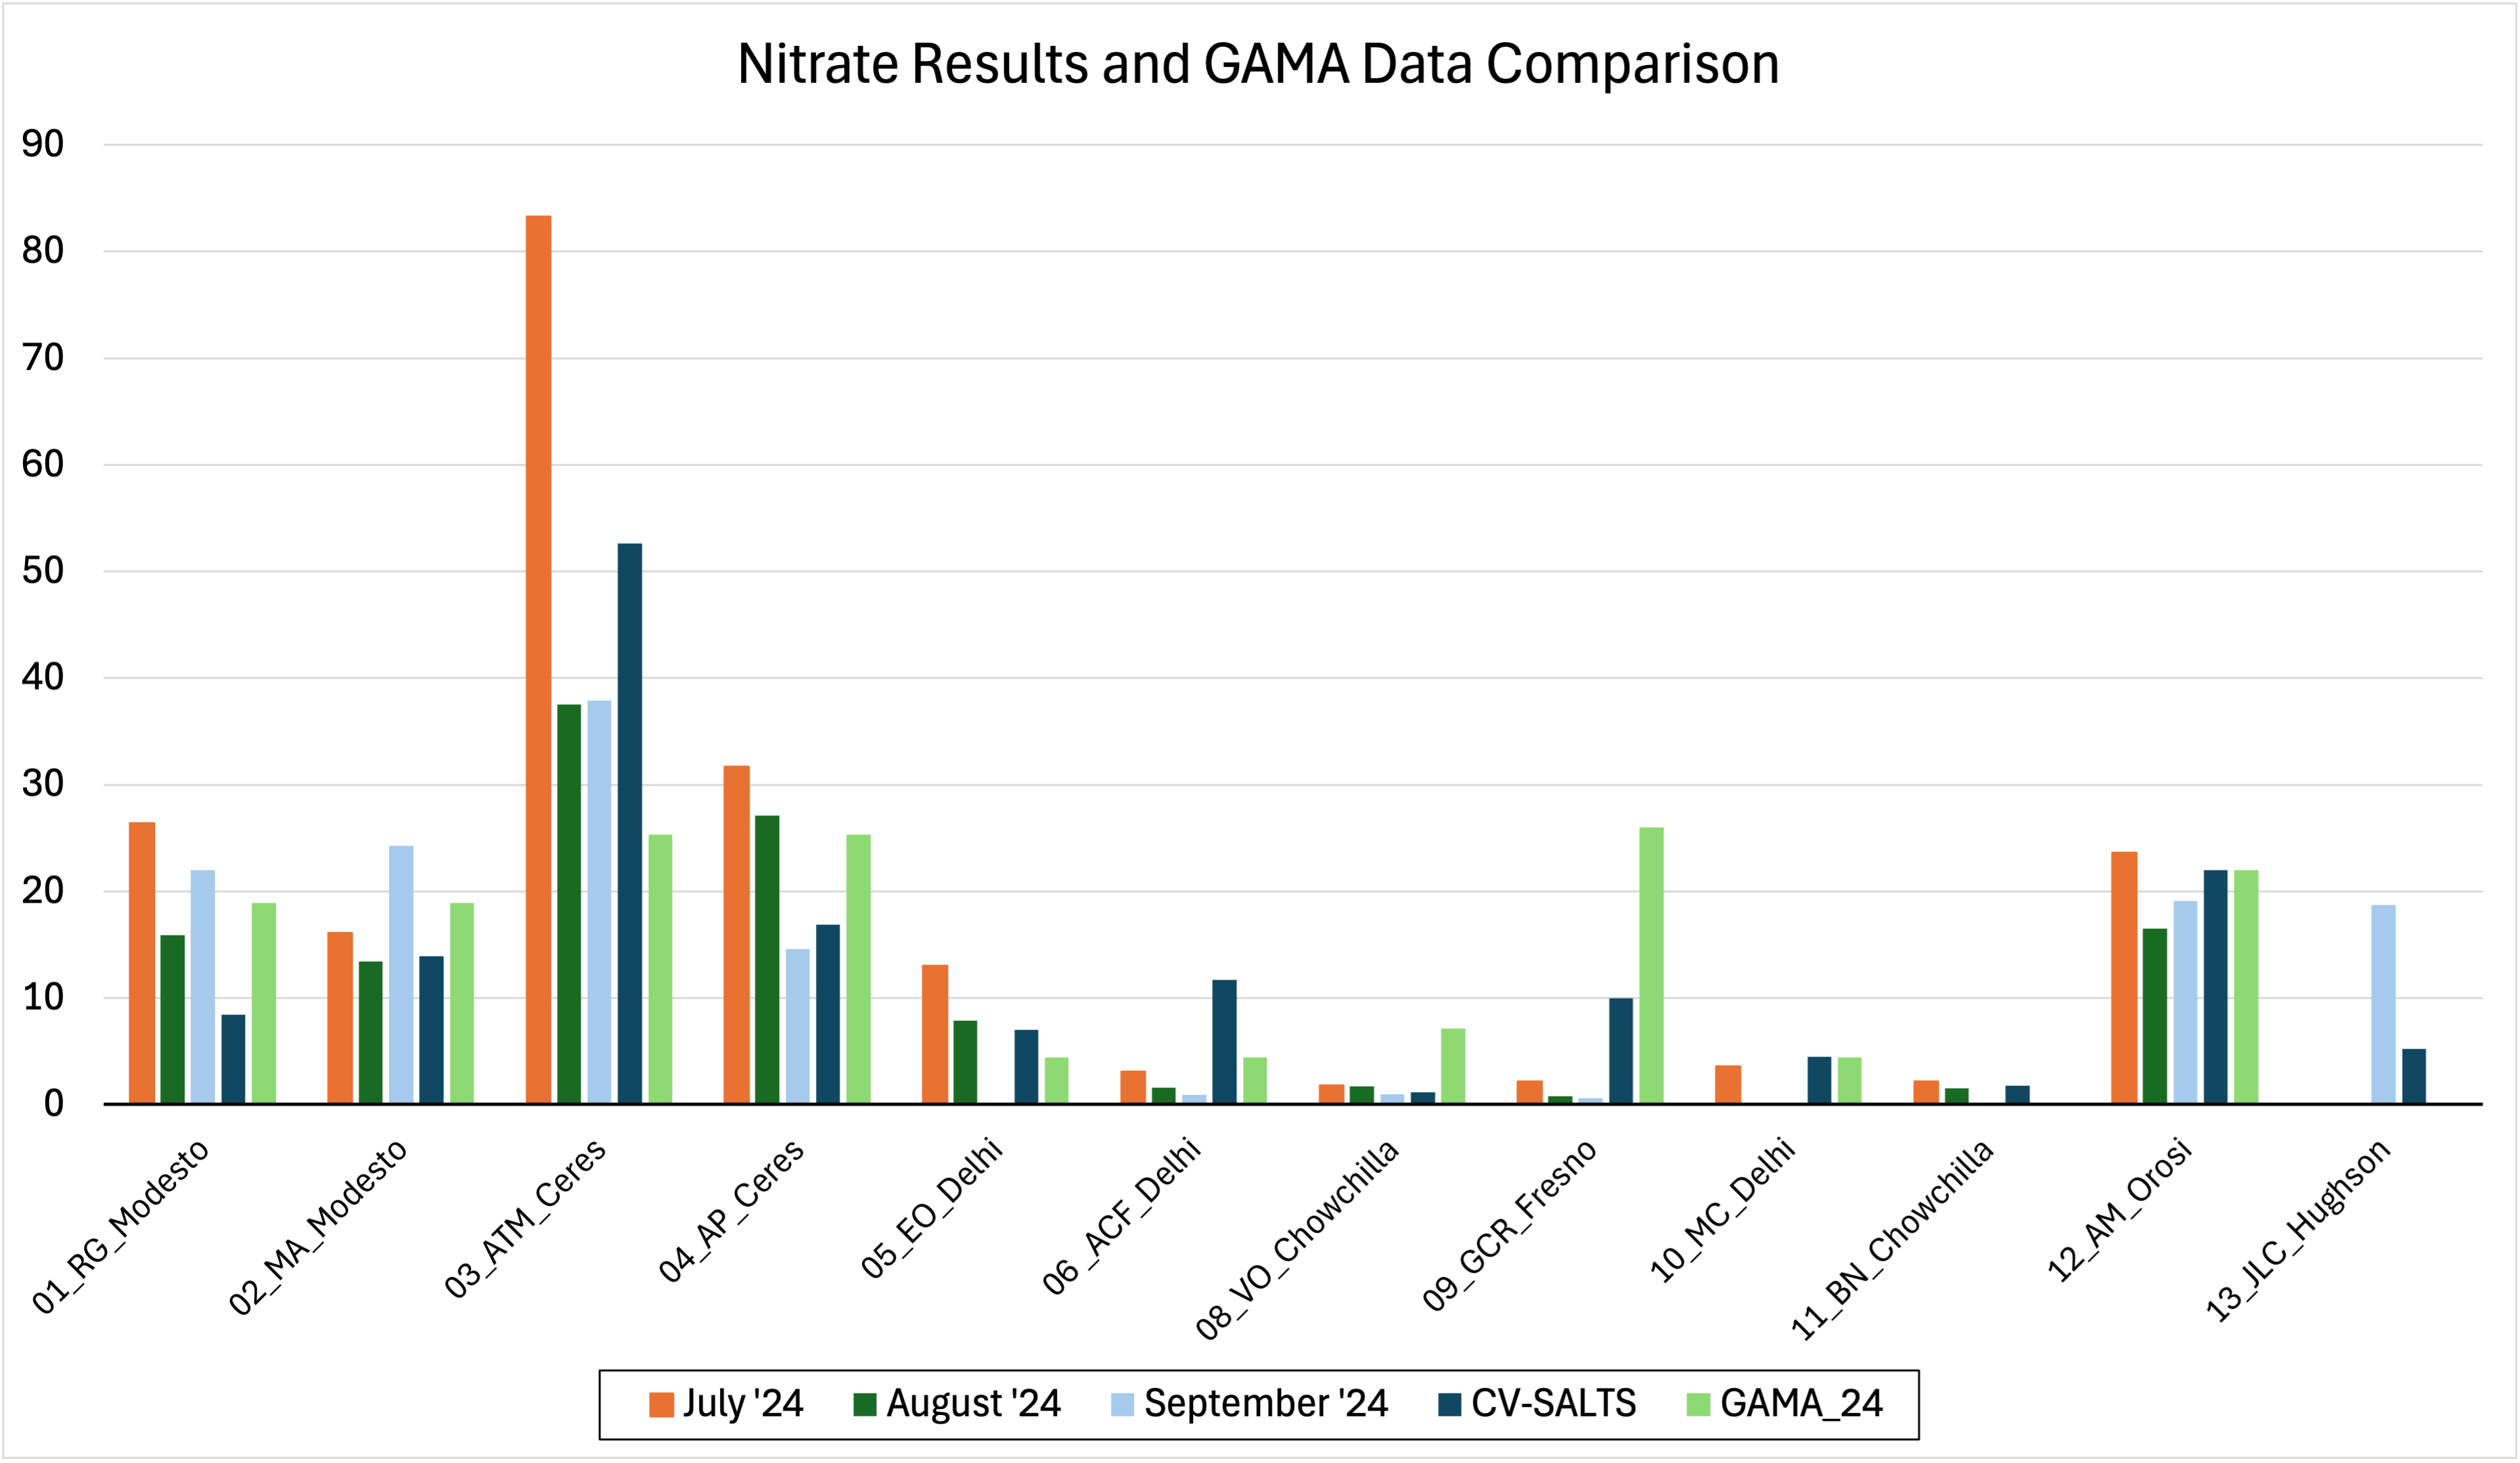
Nitrate Results and GAMA Data Comparison
The overall trend of nitrate results from July-September is shown for each resident in our program. Their results are compared to the most recent and closest data point from GAMA.
Figure by Samantha Lei, Aria Amirbahman, Jake Dialesandro, Nick Jensen, and Rosa Torres.
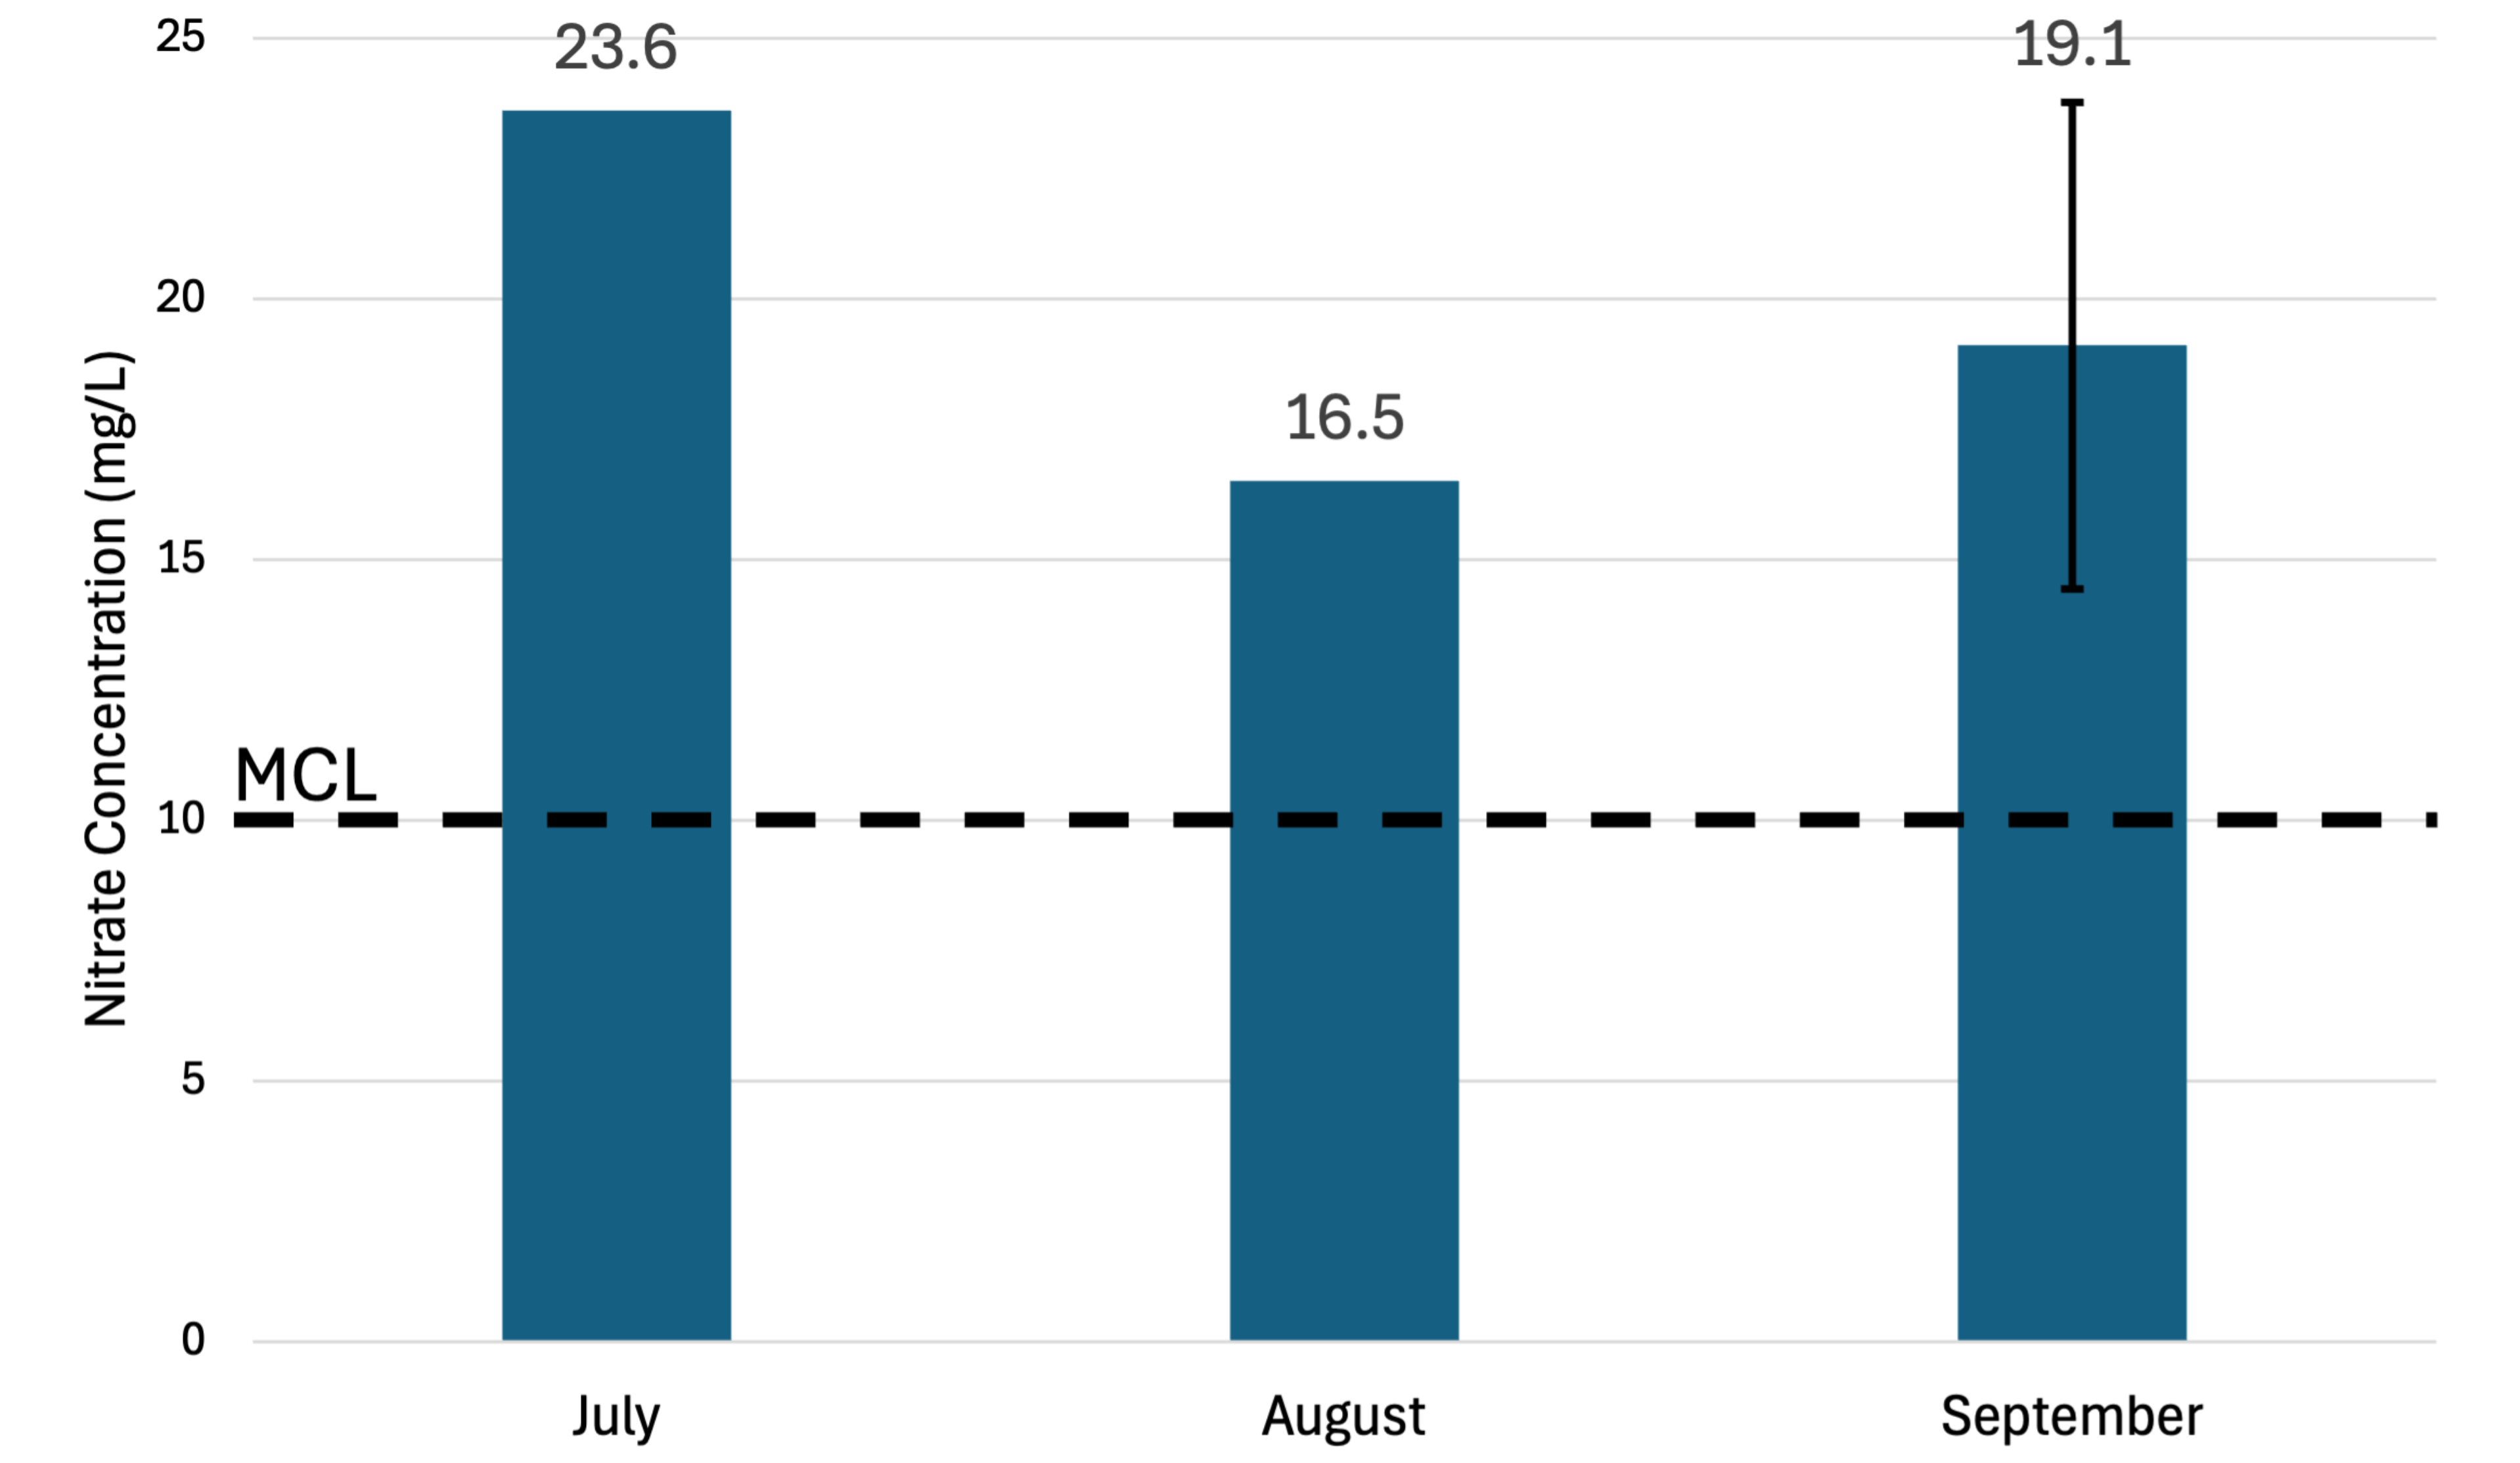
Monthly Nitrate Results Shared With Each Resident
After each sample was collected and analyzed, graphics were made and brought back to show the residents their nitrate results during the following month’s testing. This was done to visually show where the resident’s nitrate concentration was compared to the MCL and to explain/answer any questions they had about their results or trends they noticed.
Figure by Samantha Lei, Aria Amirbahman, Jake Dialesandro, Nick Jensen, and Rosa Torres.
